 ExxonMobil's US liquids production was 17.5% of its total liquids production.
Its US gas production was 33.9% of its total gas production. Plots can be
derived from the above liquids and gas production figures .
ExxonMobil Oil and Gas
ExxonMobil filed SEC Form 10-K for its activities up to the end of 2016. An extract* from it shows that it is engaged in hydraulic fracturing (fracking):-
A. Present activities
UNITED STATES
In the US in 2016 the company has partial interests in the drilling of 782 gross wells and a net interest, (the aggregate of the partial interests) in the drilling of 305 wells.
B. Review of Principal Ongoing Activities
UNITED STATES
ExxonMobil’s year-end 2016 acreage holdings totaled 12.9 million net acres, of which 1.0 million net acres were offshore. ExxonMobil was active in areas onshore and offshore in the lower 48 states and in Alaska. During the year, 442.3 net development wells were completed in the inland lower 48 states. Development activities focused on liquids-rich opportunities in the onshore U.S.*, primarily in the Permian Basin of West Texas and New Mexico and the Bakken oil play in North Dakota. In addition, gas development activities continued in the Marcellus Shale of Pennsylvania and West Virginia, the Utica Shale of Ohio and the Haynesville Shale of East Texas and Louisiana.
ExxonMobil’s net acreage in the Gulf of Mexico at year-end 2016 was 0.9 million acres. A total of 1.6 net exploration and development wells were completed during the year. The deepwater Julia project and the non-operated Heidelberg project started up in 2016. Participation in Alaska production and development continued with a total of 14.0 net development wells completed. The Point Thomson Initial Production System started up in 2016.
Certain quantities of oil and natural gas that qualified as proved reserves in prior years did not qualify as proved reserves at year-end 2016. Amounts no longer qualifying as proved reserves include the entire 3.5 billion barrels of bitumen at Kearl. In addition, 0.8 billion barrels of oil equivalent across the remainder of North America no longer qualify as proved reserves mainly due to the acceleration of the projected end-of-field-life.
World liquid proved reserves fell by this adjustment by 35.6% from 14.72 Gb in 2015 to 9.93 Gb in 2016.
In the US in 2016 ExxonMobil's net liquids production was 405 thousand barrels per day (Gb/a 0.148) and its natural gas production was 3,078 millions cubic feet per day (Gboe/a 0.187). It can be assumed that some of the liquids and most of the gas was produced by fracking.
Table of reserves and production plot
The ExxonMobil annual reports have been analysed to produce a table from which its upstream production trends can be plotted.
Oil and gas companies now show their results as barrels of oil equivalent in which natural gas is given an oil equivalent based on comparative heating values. Liquids include oil and natural gas liquids (NGLs).
 ExxonMobil's US liquids production was 17.5% of its total liquids production.
Its US gas production was 33.9% of its total gas production. Plots can be
derived from the above liquids and gas production figures .

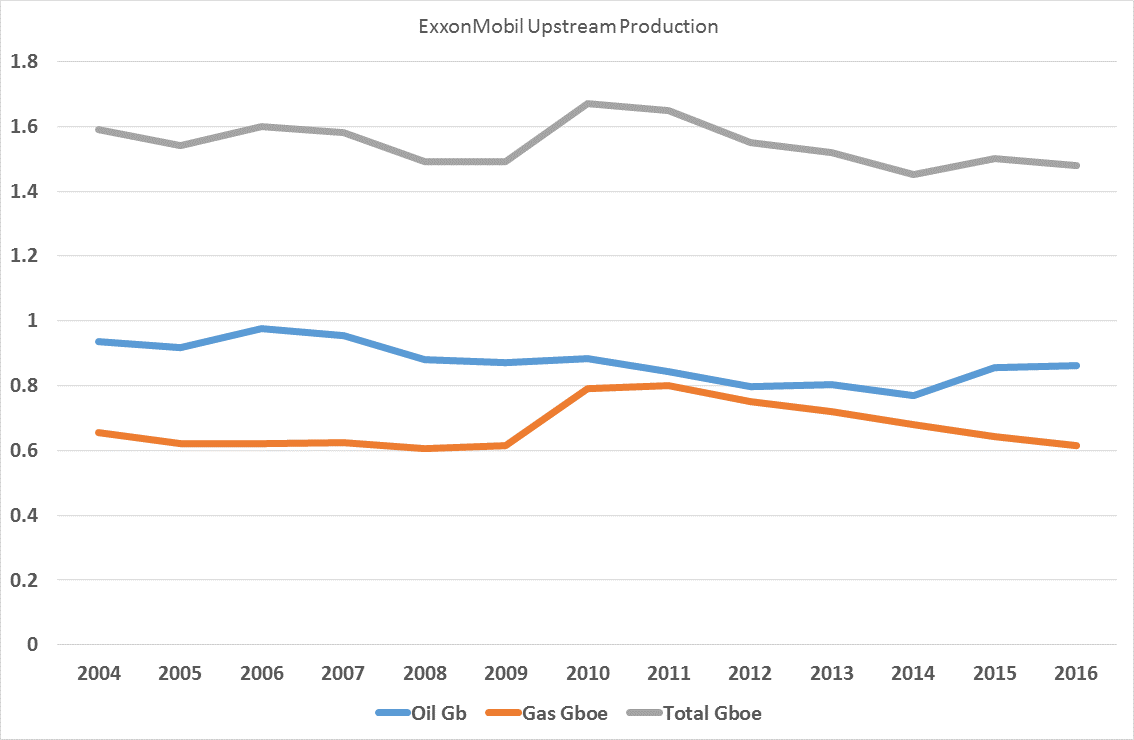
The plot shows that ExxonMobil's liquids production peaked in 2006 at 0.976 Gb and has since then declined to 0.770 Gb in 2014, but rose by 11.2% over 2014 in 2015 to 0.856 Gb and rose further to 0.863 Gb in 2016.
The fall of 21% from 2006 to 2014 reduced to 11.6% by 2016 due to the contribution of tight oil fracking.
Its natural gas production peaked in 2011 at 0.801 Gboe, but has since declined by 23% in 2016 to 0.616 Gboe.
The combined oil and oil equivalent of gas production (Gboe/annum) peaked in 2010 as it was boosted by the rise in natural gas production presumably from fracking, but has since declined by 10.2%, even though boosted in 2015 and again in 2016 by the oil shales production.
The SEC 10-K Form figures show that ExxonMobil has shifted its focus to liquids production in the oil shales showing a lift in its production in 2015. ExxonMobil has avoided the huge financial losses in fracking for gas and has allowed its production of gas to decline as shown in the gas production plot..
John Busby 03 June 2017