 Modern
life has become dependent on the extraction of basic materials; mostly
minerals from mines, both underground and open pit. In general the
quantities of these produced has risen and, most believe, will continue
to rise feeding universal economic growth. In recent years this
comfortable state of consciousness, described perhaps as
"business-as-usual" has prevailed.
Modern
life has become dependent on the extraction of basic materials; mostly
minerals from mines, both underground and open pit. In general the
quantities of these produced has risen and, most believe, will continue
to rise feeding universal economic growth. In recent years this
comfortable state of consciousness, described perhaps as
"business-as-usual" has prevailed.
John Busby challenges the widely held conviction that modern
technologies can outweigh the crippling cost of producing ever scarcer
resources
Business-as-usual
Rises in material prices are expected to provide the engine of increasing prospecting and discovery and to cover the escalation in extraction costs occasioned by lowering ore grades. Even the spectre of climate change has not irked the economists, conjoining with Stern to conclude that merely allocating 1% of a growing GDP and dedicating it to sequestrating and reducing carbon dioxide emissions would be adequate in avoiding catastrophe.
Concern over the supply of minerals has risen when considering the merits of a return to nuclear power. Concerned with the lowering of primary production of uranium from mines, the nuclear lobby has argued that the price of uranium features little in the cost of electricity and can rise considerably before it has an effect. Moderate increases in the price of uranium are expected to cover the increased costs associated with lower ore grades and extend the quantity of recoverable reserves.
Last century
The report by MIT "The Future of Nuclear Power" argued
"that there is good reason to expect that (uranium) prices will not soar to prohibitively high levels. …advances in exploration and extraction have made it possible to extract lower grades … at constant or even decreasing costs at constant dollars." [1]
The report includes a plot of mineral price indices over the last century showing progressive price decreases if reckoned in constant dollars. In 2001, USGS published a report showing the expansion of production over the century while prices decreased on a constant dollar basis. [2]
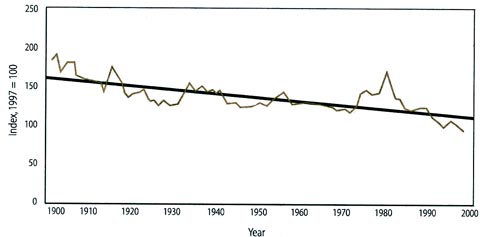
Composite mineral price index for 12 selected minerals, 1900 to 1998, in constant 1997 dollars. Selected mineral commodities include 5 metals (copper, gold, iron ore, lead and zinc) and seven industrial mineral commodities (cement, clay, crushed stone, lime, phosphate rock, salt and sand and gravel).
Decisions based on the last century's statistics would assume "business-as-usual" will continue in this century.
This century
As ore grades decline, the factors ameliorating the potential decline in availability and a rise in prices are technology and the use of energy. The USGS figures in the plot above are up to 1998, a decade ago. To show how things have changed in the present century, actual dollar prices rather than constant 1997 for strategic metals have been tabled for January 1998 and January 2008.
Table 1
USD |
|
Jan. '98
|
Jan '08 |
Increase x '98 price
|
| Platinum | oz |
377 |
1680 |
4.5 |
| Palladium | oz |
228 |
424 |
1.9 |
| Rhodium | oz |
414 |
7050 |
17.0 |
| Gold | oz |
300 |
920 |
3.1 |
| Silver | oz |
6 |
14 |
2.3 |
| Nickel | t |
4600 |
26500 |
5.8 |
| Cobalt | t |
50000 |
105000 |
2.1 |
| Molybdenum | t | 8500 | 75000 | 8.8 |
| Chromium | t |
4150 |
9300 |
2.2 |
| Titanium | t |
9700 |
8000 |
0.8 |
| Manganese | t |
420* |
1600 |
3.8 |
| Tungsten | t |
12700 |
77200 |
6.1 |
| Copper | t |
1740 |
7120 |
4.1 |
| Aluminium | t |
1515 |
2400 |
1.6 |
| Zinc | t |
1100 |
2200 |
2.0 |
| Magnesium | t |
1625* |
4500 |
2.8 |
| Tin | t |
5200 |
16000 |
3.1 |
| Lead | t |
520 |
2500 |
4.8 |
| Fe lump ore |
t |
36 |
130 |
3.6 |
| Carbon steel |
t |
650 |
900 |
1.4 |
| Stainless 304 |
t |
1850 |
4000 |
2.2 |
| Stainless 316 |
t |
3200 |
7000 |
2.2 |
| Reinforcing bar |
t |
400 |
600 |
1.5 |
*31/12/1999
USGS has recently (May, 2007) published a report [3] plotting recent price rises of 4 key alloy components, copper and steel showing, in support of the above table, that rapid price rises have occurred since 2002 for them all. Prices change on a daily basis, so it is only possible to show trends. USGS has attempted to draw some conclusions as to what are the primary price "drivers".
It concludes that "price fluctuations are greater in magnitude in recent years because prices are higher in recent years". Obviously, as USGS argues, wars, recessions, inflation and economic growth influence longer term trends. But it then goes on to argue that demand growth in China and India is the main driver, subjugating fuel prices and the falling dollar to a lesser effect.
Fuel costs
As ore grades reduce, more rock has to be moved for the same base material extracted. Moreover the extraction yield also falls, meaning that more product goes into the tailings lagoons. The level of additional fuel required is subject to disputation, but it is uncontroversial that more is required per tonne of product.
Also the refining and processing of the end products (such as steel, copper and aluminium) are energy intensive. In 1998, crude oil was $13/barrel, in 2008 it is $90/barrel and other fuels have advanced in price in parallel. A significant event in 2006 was the reduction of 4% in the net crude oil exports of Saudi Arabia, the first time that it failed to increase its contribution to world demand and the signal that it has lost its ability to "swing" supply against demand.
In the last five years, lowering ore grades and rapidly rising fuel costs are without question the main price drivers. This is not to demean the effect of the recent Asian economic boom. China has garnered a pot of dollars from selling its manufactured goods in the West, especially in the US, and will use this newly acquired financial power to procure the lion's share of materials and energy sources.
The deployment of improved extraction technologies has meant the increased use of energy, amplifying what was, at the beginning of the last century, mostly manpower (also ponies) and basic pithead gear. The efficiencies gained were based on capital expenditure in the extraction technologies, which in effect displaced the manpower needed in the past and allowed the movement of vast quantities of overburden and ores, but with a use of energy as a penalty.
The so-called nuclear "renaissance" will need immense capital expenditure up-front, both in mining, power plants and in waste processing and the rising costs of the materials of construction will make the financing of this multi-part sector an insurmountable task.
Capital requirements for the nuclear "renaissance"
A recent example of the effect of fuel costs on a project is the building of Wembley Stadium by an Australian contractor. As delays occurred, the sub-contractors' escalation clauses led to demands for additional payments. Such clauses cover the cost of the materials of construction, mainly steel and concrete aggregates, which rose constantly over the course of the project. A lesser main contractor would have been bankrupted by the extra project costs.
Olympics 2012 is dogged by rising cost estimates and will clearly be a financial disaster for its backers and will be detrimental to other pursuits normally supported by the state. Not least will be the rising costs of the travel of the participants, notably by the shortage and premium on jet fuel.
In Finland, the building of the Areva prototype Evolutionary Pressure water Reactor (EPR) has been delayed by problems in the materials of the concrete foundations and containment in which steel reinforcing is a component. But the most significant escalation may well be in the incorporated components of the alloy steels used in the construction of the reactor itself and the associated equipment. The pressure vessel is lined inside a carbon steel shell with stainless steel, which together require manganese, nickel, cobalt, titanium, chromium and molybdenum, all of which feature in Table 1 as subject to severe escalation in price.
If the number of nuclear power stations quoted in the media as likely to be built were to be built, the demand for such expensive materials would soar and the price of such would be astronomical. The estimation of the capital costs of a nuclear station, the construction of which is to be launched in 2012 and will take until 2017 to be completed, will daunt the skills of the most professional quantity surveyor!
A material world
In "The 30-Year Update" of the Limits to Growth [4] the basic relationship between ore grades and mining wastes generated is clearly shown in this next chart.
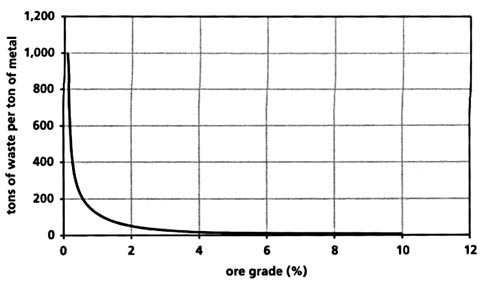
Depletion of Mineral Ores Greatly Increases the Mining Wastes Generated in Their Production
As the average grade of ore declines through depletion from 8% or more to 3%, there is a barely perceptible increase in the amount of mining waste generated per ton of final metal. Below 3% grade, waste per tonne increases dramatically. Eventually, the cost of dealing with the wastes will exceed the value of the metal produced.
This applies not just to all the metal components of a nuclear power station, but principally to the natural uranium from which the nuclear fuel is made.
The main finding of the original "Limits" was that the efficiency of capital decreases as resource prices rise and mines are depleted. As the efficiency of it decreases, so must the best use of the available capital be made and directed to sustainable projects able in the long term to reduce our needs for materials and energy. (Société Générale has just lost $7 billion of its capital playing the markets, enough perhaps to build one nuclear station at today's prices, but inadequate to build one from 2012 through to 2017!)
The argument of the nuclear lobby that rising energy prices will allow the lower grades to be extracted within the overall economy of nuclear generation is fundamentally flawed. The systems dynamics approach of the "Limits" analysis allows the complex interaction of demand, supply and resource depletion to be understood. It warns of "A material world" devoid of materials.
The findings of "The Limits to Growth" have been rejected – realism is not an acceptable political philosophy.
[1] http://web.mit.edu/nuclearpower/
[2] http://pubs.usgs.gov/of/2001/of01-197/2001-197.pdf
[3] "… and Steel Price Drivers" http://pubs.usgs.gov/of/2007/1257/
[4] The Limits to Growth – The 30-Year Update, Meadows et al, Chelsea Green Publishing Company.
Appendix (i)
To maintain its standard of living, each person in the United States requires over 22 tonnes of minerals each year:
Plus:
- 5,640 kg of stone
- 4,250 kg of sand and gravel
- 430 kg of cement
- 125 kg of clays
- 180 kg of salt
- 140 kg phosphate rock
- 290 kg of non-metals
- 190 kg of iron ore
- 35 kg of bauxite (aluminium)
- 8 kg of copper
- 5 kg of lead
- 5 kg of zinc
- 3 kg of manganese
- 1 g of gold
- 13 kg of other metals
- 3,500 kg of petroleum
- 3,500 kg of coal
- 3,100 kg of natural gas
- 150 g of uranium
Source: http://www.worldchanging.com/archives/007708.html
Appendix (ii)
Wheal Jane Mine in Cornwall, UK
Wheal Jane mine in Cornwall UK, produced tin, copper, lead silver, zinc and iron ore plus other minerals from 1847 to 1991. It first closed in 1884, re-opened in 1906, only to close in 1915. In 1969 it re-opened with new technology and ran, though interrupted for two years, until 1991 when it was finally closed. When the pumps stopped in 1992, millions of litres of toxic metal-rich water were released into the Carnon River until a treatment plant was installed. However, waterbirds still die from lead and zinc poisoning.
There is no doubt that modern technology can extend the life of a mine for a while, until the inevitable fall in ore grades defeats even the best of them.
Source: http://www.cornwall-calling.co.uk/mines/carnon-valley/wheal-jane.htm