Why nuclear power is
not a sustainable source of low carbon energy
1. Introduction
Although not every scientist agrees, emissions of carbon
dioxide from the combustion of fossil fuels, mostly petroleum, natural gas and
coal are considered to be a major factor in causing the onset of global warming.
Unacceptable rises in temperature are leading to rising sea levels from the
melting of polar ice and corresponding climate changes may effect plant and
animal life in otherwise temperate zones.
Technological advances reduce the growth in energy demand
to around 1% below the rate of economic growth, but the world’s demand for
energy is expected to continue to rise exponentially, particularly in respect to
emerging economies such as China and India. What is desired is a number of
renewable sources of energy, not limited by resource depletion (as is the case
with fossil fuels) and that are “clean” in that they emit little or no
so-called “greenhouse gases”. Renewable sources include wind and sea current
power, but there is a so-called “renaissance” in nuclear power, which is
purported to meet both criteria.
A rising awareness of the imminence of a peak in crude oil
production together with the increasing demands for energy of the developing
economies, together with concern over climate change has stimulated interest in
the replacement of stations due for closure, extension of the operational life
of some and the building of new stations.
A nuclear power station of 1000 megawatt electrical
generation capacity (1000 MWe or 1 gigawatt electrical = 1GWe) with a load
factor of 0.9 requires around
200 tonnes (metric tons) of uranium per annum. For example, in 2008 the United States
had 104 operating reactors with an average generation capacity of 972 MWe which
are expected to consume 18,867 tonnes of natural uranium equivalent in 2009.
Uranium production is subject to the same “Hubbert”
cycle which characterised US oil production, which peaked in 1970. In spite of
improved extraction technology oil production has declined since then, so that
currently
around 65% of US oil demand is imported. An individual uranium mine
provides a rapid build-up followed by uniform production over 5 –10 years
after which it declines and is closed. To maintain supply a series of mines have
to be opened in succession. As the propensity of prospective new mines in
respect to the depth and ore grades tends to be progressively lower, the
succeeding mines require ever greater energy inputs for the same production. In
consequence the aggregate of the individual mine supply curves
produces a world “Hubbert” peak in uranium production which will eventually
limit the level of “once-through” nuclear power generation, whereby spent
fuel is not re-cycled.
This limit was recognised from the inception of nuclear
power resulting in several abortive attempts to develop fast breeder reactors
and waste recycling processes. In December 2002 ten nations produced “A
Technology Roadmap for Generation IV Nuclear Energy Systems” which concluded
that to extend the nuclear fuel supply into future centuries it will be
necessary to recycle used fuel and convert depleted uranium rejected from the
enrichment process to new fuel. Six types of reactor were considered, three of
them fast, each
requiring US$ 1 billion to take to a demonstration phase in 2025. The authors
found it impossible to choose between the six options and recommended “crosscutting
R&D” between rival
participants. (1) However, from the six types, two have been selected for
implementation, one very high-temperature reactor for hydrogen production and
one fast reactor, constituted as a "burner" to reduce waste rather
than as a "breeder" to provide fuel supply sustainability, the
development of which appears to be abandoned.
MIT’s study “The future of nuclear power” opted for the “once-through”
mode in which discharged spent fuel is sent directly to disposal.
The team believe that “the
world-wide supply of uranium ore is sufficient to fuel the deployment of 1000
reactors over the next half-century”.
In an appendix (5.E) they argue that the extraction of low concentrations of
uranium in phosphate deposits will suffice for a programme ending with a “1500
GWe scenario” by mid-century.
(2) In any case, in the USA reprocessing is prohibited and spent fuel resides in
ponds until it is "cool" enough to be placed in dry casks, then stored
in the open. Whether the contents of the dry casks end up stored in the ultimate geological
underground repository under Yucca mountain is now uncertain, as the project is
suspended..
The World Nuclear Association (WNA) also recognises that
regular mined supplies of uranium are limited and sees the survival of its
industry in the universal occurrences of uranium in the earth’s crust and in
seawater.
In judging the sustainability of nuclear power the
continuing availability of its uranium-based fuel is the main consideration. As
will also be shown, the carbon emissions from the overall nuclear fuel cycle are
inversely-exponential to the grade of ore from which its uranium source is
extracted, the lower the grade, the more energy to retrieve it is needed and the
more carbon dioxide is emitted.
2. Could all our
energy be supplied by nuclear power?
Before considering alternative sources, it is necessary to
understand the size of the problem by examining current global energy
consumption. Energy units exhibit little uniformity, but the joule can be used
as a universally acceptable basis for analysis. Big numbers have to be employed
to express global energy parameters, i.e., the exajoule (joule x 1018)
and the petajoule (joule x 1015), abbreviated as EJ and PJ
respectively. The world’s primary energy consumption in 2008 was 473 EJ, of which
88% was provided by fossil fuels. Of this
72.7 EJ was in the form of electrical energy (20,202 TWh), with 9.4 EJ (2,601
TWh) which is 13.0%
of it
provided by nuclear generation.
If not restrained by uranium supply problems, nuclear power
could in theory substitute for gas and coal for all the world’s electricity
generation, but electricity is not readily adaptable for mobile transport.
Transport constrained to fixed guide systems, such as rail
and tramways can use electrical energy directly from current collectors, but
mobile transport able to move on roads or rough terrain uses mostly liquid fuels
derived from oil. As oil reserves deplete, liquid fuels will be synthesised
increasingly from natural gas and then coal, until all fossil fuels able to be
economically extracted are exhausted.
To use electrical energy as an alternative to conventional
liquid fuels for mobile transport requires the production of hydrogen from
electrolysis and its subsequent cryogenic liquefaction for on-vehicle storage.
This has an inherent energy penalty over the derivatives of primary fuels and of
course, unless the electricity used to produce the hydrogen fuel is from a
renewable and “clean” source, offers no panacea to global warming.
Assuming
mobile transport requires 40% of global primary energy (473 x 0.4 = 189 EJ) and taking into account the
energy efficiency of a diesel engine at 46%, the useful energy is 87 EJ. Taking
into account the lower heating value of hydrogen (120 MJ/kg), this is equivalent to
725 x 109 kg H2, which to get in its liquid form requires
by electrolysis and liquefaction 75 kWh/kg equivalent to 54,375 TWh, which at
34% generation efficiency requires 576 EJ of primary energy. So if transport could be based
on a hydrogen economy the primary energy requirement for global electrical generation
rises from 473 EJ to 860 EJ. (i.e., 473 -189 +576 = 860) The problem is that electrical energy of whatever
means of generation is a poor substitute for the adaptable primary energy
obtained from fossil fuels.
Assuming world economic growth of 3%/annum, with growth in
energy requirements 1% less, extrapolating from 2008 to 2020, increases the
energy requirement to 1090 EJ. Even this amount of nuclear primary energy may be
insufficient as it is unlikely that nuclear power plants could be
sited next to factories and housing schemes requiring just heat, so the energy
would have to be transmitted and used as electricity.
A typical 1GWe nuclear power plant produces
85 PJ of primary energy per
annum, so to provide for 860 EJ around 10,000 1GWe (or 6,000 Areva 1.6 GWe EPR) nuclear power stations would have
to be built. To provide for 1090 EJ would require 13,000 1GWe (or 8,000 Areva
1.6 GWe EPR) stations. Each 1GWe station requires
200 tonnes/annum of natural uranium for the manufacture of its fuel. So to fuel
the primary energy requirements of 860 EJ and 1050 EJ would mean the production
from mines of around 2 million tonnes/annum or 2.6 million tonnes/annum) of uranium
respectively.
In 2008 world annual mine production totalled only
43,764 tonnes of uranium, of which Canada produced 9,000 tonnes and Australia
8,430 tonnes resp. Kazakhstan increased its production by 28% over 2007, but as
this is from a number of small in- situ leaching (ISL) it may be somewhat
ephemeral. Only Canada has reserves of high grade ore, while the grade of the ores
remaining in Australia progressively lowers. The balance of 20,640 tonnes
required to meet the 2009 nuclear generators’ demand for 65,405 tonnes will
have to come from inventories, ex-weapons material, MOX and re-worked mine tailings.
This secondary uranium supply is due to run out by 2013, so primary
production would have to be increased 60-fold to match the anticipated global
energy needs exclusively from nuclear power in 2020. (3)
From the above projections it is clear that nuclear power
has no chance of matching the coming energy deficit by supplying the needs of an
equivalent hydrogen economy to that currently sustained by fossil fuels. Even if
there was sufficient uranium to fuel it, the building of a parc
of 8,000 to 13,000 nuclear power stations would be an impossible prospect. The
processing and sequestering of the consequential enormous volume of radioactive
waste would be also be an impossible task.
3. Can the world’s
electrical energy be supplied by nuclear power?
The MIT team have produced a more modest plan for the
building of power stations to provide 1,500 GWe of nuclear generation capacity
by 2050, which would provide 13,140 terawatthours per annum (TWh), about a third
only of the anticipated global total electricity consumption of 39,000 TWh in 2050.
The uranium requirement for their programme over the 45 years from 2005 to then
amounts to 9.5 million tonnes. In 2050, the uranium demand would be 306,000
tonnes/annum, which would require a 7-fold increase in current mining
production rates. But they assume a total uranium consumption for their scenario
of 17 million tonnes, because the average remaining life of the parc
after 2050 would require a further 7.5 million tonnes.
Uranium reserves of ore of a sufficiently high grade (see 5
below for a definition of this) were estimated at only 4,700,000 tonnes (but now
exaggerated claims of 5.5 million tonnes have been promoted.) So to
get round this difficulty, MIT compute that the reserves can be expanded to suit
the requirement by progressive increases in the uranium price. They consider
that ore deposits of grades between 0.001% and 0.03% would hold 22 million
tonnes of uranium and would be viable at increased uranium prices without
unacceptable consequent rises in the electricity price. However, with the
processing of these low ore grades there is a yield loss and larger energy
inputs, leading to a negative energy gain in the overall nuclear fuel cycle.
In 2050 when reactors of 1500 GWe generation are in
service, if the required 306,000 tonnes/annum of uranium were to be extracted
from the best of the low grade ores, i.e., 0.03%, with an optimistic yield of
50%, the mining of 2 billion tonnes of rock, plus the removal of the
over-burden, would be needed every year. Assuming that by 2050 the best of the
ores has been taken, to extract the same from the lowest remaining, i.e. 0.001%,
the yield would be even lower at say 10% and the production of 306,000 tonnes of
uranium would require the mining of 300 billion tonnes of ore, plus the
overburden. (4)
World phosphate mining results in
150 million tonnes of phosphogypsum accumulating every year in diverse locations
as a waste product containing 10-20 ppm of uranium. If the uranium was extracted
it would only produce 1,500 to 3,000 tonnes of uranium, so its production as a
co-product does not seem a viable possibility.
The scale of such inconceivable operations and the
commensurate input energy provided largely by fossil fuels is totally
non-viable. MIT has failed to give the location of the low grade deposits of
uranium ore on which their programme depends or to examine the methods of
extraction and the energy consumption related to the ore grades assumed.
There is no chance that a parc of 1500 GWe of
nuclear power plants, providing only one third of the projected electrical
energy consumption in 2050, can be fuelled.
4. Is there enough
uranium to supply the currently operating nuclear stations for their remaining
years of operation?
There is a current world building programme of around
52 new stations, with some 135 further stations on order or planned. Some existing
stations are having their operational life extended and some are now being
de-commissioned. The Fukushima incident has had a profound effect on uranium
supplies. The revised 2011 (equivalent) uranium fuel demand of 62,552 tonnes/annum
was required by 434 operating stations averaging 853 MWe capacity each..
The secondary sources of uranium,
consisting of ex-weapons material, ore stocks, re-worked mine tailings and a
modicum of mixed-oxide, which
provided 33% of the fuel demand in 2008 and expected to be exhausted by 2013,
only provided 14% of the demand in 2011. Since Fukushima the uranium price has
fallen, restricting investment in new mines. The Areva Namibian mine Trekkopje,
destined to supply new nuclear build in China, is disappointing expectations. As
many of the
operating stations in Japan and Germany have now closed, it remains to be seen
how the fuel supply will mature, depending on how
many will have become obsolete and closed, how many have their operation lives
extended and how many are built and commissioned in the intervening period.
The end of the price competition from secondary sources
might intensify mining activity and lead to a resurgence in production, but to
open new mines, always assuming that suitable opportunities emerge to locate
them, will take more than the intervening years.
The current demand/supply situation is best illustrated by
Table 1.
Table 1 Uranium demand, mining production and deficit in
tonnes
|
Country
|
Uranium required
2011
(WNA)(5)
|
% of world demand
|
Indigenous mining production
2010 (WNA)(6)
|
Deficit
|
|
USA
|
18,376
|
29
|
1,660
|
16,716
|
|
France
|
9,254
|
15
|
0
|
9,254
|
|
Japan
|
2,805
|
4
|
0
|
2,805
|
|
Russia
|
4,912
|
8
|
3,562
|
1,350
|
|
Germany
|
1,934
|
3
|
0
|
1,934
|
|
South Korea
|
4,029
|
6
|
0
|
4,029
|
|
UK
|
2,093
|
3
|
0
|
2,093
|
|
Ukraine
|
2,288
|
3
|
860
|
1,428
|
|
Canada
|
1,845
|
3
|
9,783
|
-7,938 Surplus
|
|
Spain
|
1,379
|
2
|
0
|
1,379
|
|
Sweden
|
1,366
|
2
|
0
|
1,366
|
|
Rest of world
|
12,271
|
20
|
|
|
|
Total
|
62,552
|
100
|
53,663
|
8,669 (14%)
|
Unsurprisingly the USA, the world’s largest consumer of
oil and gas, turns out to be the biggest consumer of uranium. The USA consumes
25% of the world’s oil production, 25% of its gas and takes 29% of the
world’s available uranium, while producing only 9.0% of its requirements from its own mines.
The figure of 18,376 tonnes of natural uranium shown for the US is an
equivalent.
Half of the fuel consumed is imported from Russia under the
Megatons to Megawatts agreement as uranium hexafluoride, made by blending
ex-weapons highly-enriched uranium with re-enriched enrichment tails, requiring
a large capacity in seperative work units (SWU), which the Russians possess. The
release of US ex-weapons HEU also occurs, but its diluting to fuel grade low
enriched uraniun (LEU) relies on new centrifuge facilities, the state funding of
which has been suspended. The
agreement is set to terminate in 2013 and, as can be seen from Table 1, Russian
internal supplies are in deficit and it is unlikely to be renewed thereafter. There
is a tentative agreement for the 'limited' import of Russian low enriched
uranium as a follow-up, but this merely allows it to enter the US, not guarantee
its supply.
France ranks second
and relies on nuclear power for 76% of its electricity. But since its own mines
are now worked out, it is the most insecure. Japan ranks next followed by
Germany, Russia, South Korea and the UK. The combined uranium consumption of the
principle eleven nations with nuclear power totals 50,282 tonnes (80% of the
supply), compared with their own primary mining production in 2010 of only
15,865 tonnes (29.6% of the primary supply).
A parc
of around 450 GW of nuclear power stations, maintained by the replacement of
ageing reactors and the building of yet more, would require a supply of 90,000
tonnes/annum, so that mining production will have to double in the
next 7 years – an unlikely prospect.
In Canada, the leading supplier of uranium, two mines have
closed and two of the three operating uranium mines have passed their “Hubbert” peaks as is shown in the
plot below. (7)
For production to remain at its 2005 level a series of new mines will need
to be opened. Canadian primary production was 11,597 tonnes in 2005,
falling to 8,786 tonnes in 2009. Later production was boosted by secondary
production from low grade tailings.
The reason for the severe drop in Canadian production is the failure to open the
new Cigar Lake mine due to catastrophic flooding while the McArthur River mine
may have started its Hubbert decline. To maintain constant production a series
of new mine openings is required. Meanwhile in 2006
in Australia, production (7,593 t U) was 20% below its level in 2005 (9,516 t U)
due to the decline in
grades at the Olympic Dam underground mine and the flooding of the Ranger mine,
recovering somewhat in 2007 (8,611 t U) and in 2008 (8,430 t U) at 11.4% below that in 2005. The replacement of the Olympic Dam
underground mine by an open pit is not due
to start until 2014. If
it goes ahead the first ores will be reached in 2019 after 5 years of excavation
to remove 2 billion tonnes of rock. The closure of the Ranger mine is likely to
be avoided as a feasibility study into its possible continuation is
underway.
The recent rise in
world uranium production is due to the rise in Kazakhstan, but this may be a
temporary phenomenon as the ISL method offers a rapid build up followed by an
equally rapid decline. However its production is pre-sold to China, Japan, Korea
and Russia.
As there seems little
chance of replacing the entire lost secondary sources or stemming the decline in
primary mining production, a shortfall in fuel supply seems inevitable and the nuclear
contribution of electricity generation will progressively decline.
5. Is nuclear power
“clean”?
Then the claim for the carbon-free status of nuclear power
proves to be false. Carbon dioxide is released in every component of the nuclear
fuel cycle except the actual fission in the reactor. Fossil fuels are involved
in the mining, milling, conversion and enrichment of the ore, in the handling of
the mill tailings, in the fuel can preparation, in the construction of the
station and in its de-commissioning and demolition, in the handling of the spent
waste, in its processing and vitrification and in digging the hole in rock for
its deposition.
The lower the ore grade, the more energy is consumed in the
fuel processing, so that the amount of the carbon dioxide released in the
overall fuel cycle depends on the ore grade. Only Canada has ores
of a sufficiently high grade to avoid excessive carbon releases and to provide
an adequate energy gain. At ore grades below 0.01% for ‘soft’ ores and 0.02%
for ‘hard’ ores more CO2 than an equivalent gas-fired station is
released and more energy is absorbed in the cycle that is gained in it. Ores of
a grade approaching the “crossover” point such as those in India of 0.03%,
if used, risk going into negative energy gain if there are a few “hiccups”
in the cycle.
The Olympic Dam mine in Australia, described as potentially
the world’s largest uranium producer, survives as a co-producer of copper,
silver and gold, but even so the uranium ore grade averaging 0.04% is below the
current industry “cut-off” point of 0.08% for economic viability. The future of the mine is the
subject of a feasibility study into its conversion from an underground to an
open pit 3km x 3km x 1km deep, but the owners have stated that without the
copper the expansion would not be considered. As the price of diesel rises, the
incentive for Australians to import expensive oil to provide others with nuclear
energy reduces and with it a large potential for emissions of carbon
dioxide.
The industry points to the presence of uranium in
phosphates and seawater, but the concentrations are so low that the energy
required to extract it would exceed many times the energy obtained from any
nuclear power resulting and the resulting carbon emissions would be massive.
When the energy inputs, past, present and future are
totalled up and set against the actual energy derived from the entire nuclear
power programme and its waste handling, it may well be that the overall energy
gain has been negative. This has been masked by the availability of cheap fossil
fuels, but as that era passes it behoves energy professionals to make an honest
assessment of the energy and monetary economics of proceeding further with a
failed technology.
In the UK in 2006
the government's Energy Review concluded that nuclear power can only be economic
if its claimed low carbon status allows it to sell its "carbon
credits" to carbon-emitting generators requiring an off-set. As fossil
fuels will be considerably depleted before the operational cycles of the
proposed new fleet of nuclear stations end, the generators are asking for guaranteed
carbon credits for a 100 years to justify their investment, in effect demanding
a subsidy.
6. Global warming
Some politicians
reckon the world needs need to stop 80% of
carbon dioxide emissions, but even if nuclear power is
considered to be carbon free it only provides 26 EJ, i.e., 5.5% of the
current world primary energy or 2% as electricity. So there is no possibility of an
expansion of
nuclear capacity solving to any significant degree the problem of global
warming.
It is claimed that nuclear power meets the two
characteristics of sustainability and zero or low carbon dioxide emissions and
so might be able to substitute for fossil fuels once they are exhausted and in
the meantime to avoid release of some greenhouse gases. The claims are baseless.
In conclusion, perhaps the scale of global warming has been
overstated by omitting to take into account fossil fuel depletion. A guide to
the maximum amount of carbon dioxide released from the combustion of fossil
fuels can be calculated, given that they are limited. The graph below shows that
if economic growth continues as currently, the reserves of oil, gas and then
most of the coal will have emptied by the end of the century. From a knowledge
of the carbon content of the three fuels, it is then possible to work out the
total amount of carbon dioxide likely to be released.
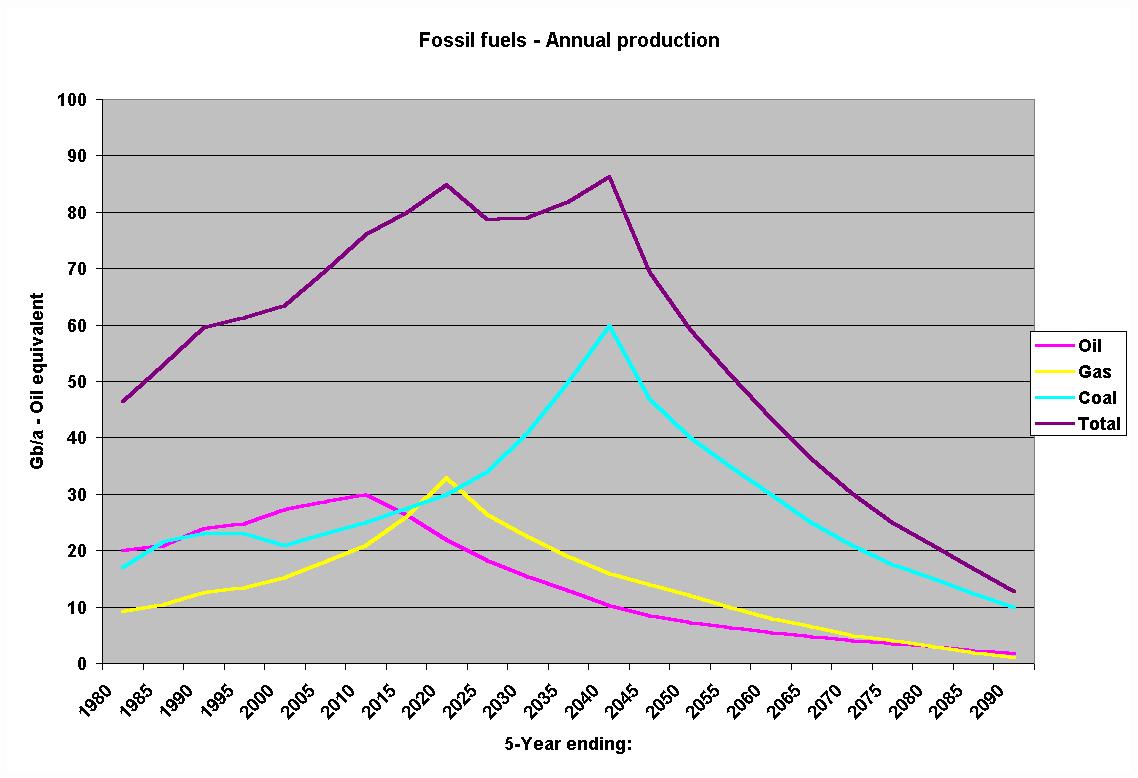
This comes out as 5 exagrams or 5,000 billion tonnes.
An earth scientist should be able to work out the
temperature rise that the release of this limited amount, mostly over the next
50 years, is likely to produce. Before hampering the world with useless measures
unable to reduce the eventual amount of the release of carbon dioxide, it would
be more appropriate to estimate the ultimate consequences of today’s
immoderate exploitation and exhaustion of fossil fuels.
The real problem the world faces is the depletion of fossil
fuel reserves – the very same depletion will ease the carbon burden of the
atmosphere by an inexorable emptying of its energy resources by the world’s
economies.
© John Busby
Revised 17 January, 2012
(1) “A technology roadmap for Generation IV nuclear
energy systems” http://gif.inel.gov/roadmap/pdfs/gen_iv_roadmap.pdf
(2) MIT “The Future of Nuclear Power”, http://web.mit.edu/nuclearpower/
Pages 152-155 Appendix 5.E -- Price and Availability of
Uranium
(3) WNA Symposium 2004, Dzhakishev,
http://www.world-nuclear.org/sym/2004/pdf/dzhakishev.pdf
(4) Storm van Leeuwen and Smith http://www.stormsmith.nl
(5) http://www.world-nuclear.org/info/reactors.htm
WNA Table
(6) http://www.world-nuclear.org/info/uprod.html
Production tU
(Multiply by 0.848 and convert
lbs U to tonnes)
(7) http://uic.com.au/nip03.htm
(8) Title page of The Busby Report