Trends of 6 Oil Majors
Preamble
Economists and energy analysts are divided as to whether the passing of a peak in global oil production is a present reality or is so far ahead that its occurrence can be discounted.
We are also being persuaded that our near energy requirements can be met by the successful development of tight oil and shale gas, the reserves of which it is argued are universally spread over the world. The technology of “fracturing” or “fracking” is under rapid deployment in the US. Tight oil from the Bakken and Eagle Ford shales has provided competition for diluted bitumen imported from the Canadian tarsands, while shale gas has largely replaced the importing of LNG into the US and plans are laid to export LNG. However, fracked well production falls off rapidly and overall play production can only be maintained by an increasing drilling of new wells
Because natural gas can be used to sythesise liquid fuels and chemicals it has been assumed that it has a “oil equivalent” and this has been variously evaluated by a comparison of the heating values of oil and gas. Conversion values of between 5,500 and 6,000 cubic feet (cf) of gas are assumed to be equivalent to a barrel of crude oil (boe).
In the annual reports of the six major oil companies selected for analysis, all have presented their combined production of oil and gas in barrels of oil equivalent, while presenting their figures for natural gas production in billions of cubic feet or metres (bcf or bcm). Some have given figures for reserves only in barrels of oil equivalent, without distinguishing between the size of oil and gas reserves.
Annual Reports
Seventy-two annual reports have been studied and a series of tables constructed, with volumetric gas figures presented as billions of barrels of oil equivalents (Gboe) by applying the conversion ratios or by subtraction of billions barrels of oil (Gb) from the totals of barrels of oil equivalents (Gboe).
Using spreadsheet formulae the aggregate values of the six majors are presented in a seventh table entitled All
From
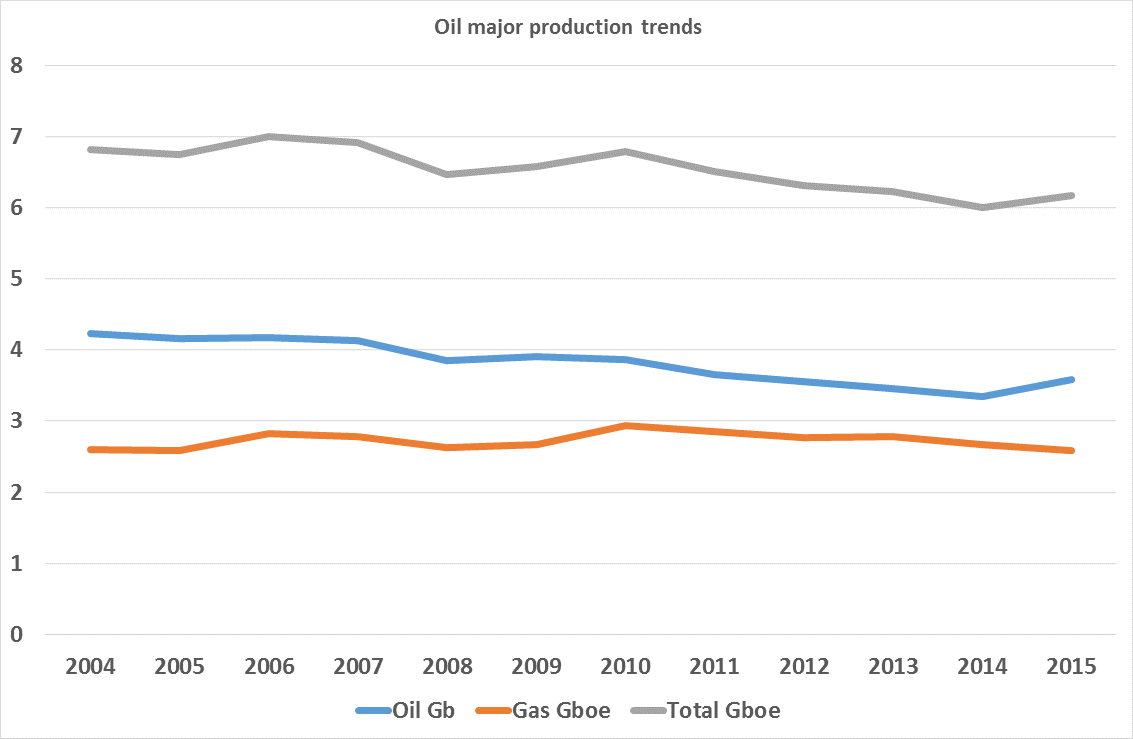
this aggregation of the six results it is evident that their combined crude oil
production has declined from Gb
4.225 in 2004 to Gb 3.379 in 2015, a fall of 20% over the eleven years, but a
rise of 7.2% over that in 2014.
Their combined natural gas production has risen from Gboe 2.595 in 2004 to Gboe 2.589 in 2015, a fall of 0.2%, due to a fall of 3% from that in 2014.
This
has meant that their total upstream production in Gboe has fallen from Gboe
6.821 in 2004
to Gboe 6.168 in 2015, a fall of 9.6% over the eleven years, but a rise of 2.7%
over that in 2014.
Combined trends
Oil equivalents
The attribution of comparative heating values to evaluate an oil equivalent of natural gas is only valid when the oil and gas are used for heating.
If the natural gas is transported as LNG, then there is a heating value penalty of 15% or so, depending on the energy used for cleaning up the gas prior to liquefaction, the liquefaction and transportation and eventual regasification and its transmission.
If the natural gas is used to synthesise liquid fuels, then there is a heating value penalty of around 50%.
Some oil production figures include bitumen derived from tarsands. As there is a 30% energy loss in its conversion to synthetic crude oil (SCO), there is a need for its conventional oil equivalent to be discounted.
As the proportion of SCO upgraded from bitumen and from gas-to-liquids (GTL) processes increases, so the total barrels of oil equivalent should be marked down to compensate for the contribution of gas needed to upgrade the bitumen and that lost in in the GTL processes.
Gas takes more of a proportion of the oil equivalent production claimed by the majors than is justified. Some gas may be double booked, if it is included in the gas production figures, but not subtracted when used in the synthesis of SCO, in GTL processes or for producing and transporting LNG.
Company peaks
Exxon Mobil had its company oil peak in 2006, BP its in 2005, Shell before 2004, Total before 2004, ConocoPhillips in 2006 and Chevron in 2010.
Conclusions
This analysis of company annual reports in regard to oil and gas production has been conducted from the published annual reports of the six oil majors. Institutional reports rely on national statistics which are subject to political interference and delay, but annual reports are audited and the production figures correspond to the revenue they produce. Nevertheless the amounts claimed as barrels of oil equivalent need to be subjected to regulatory scrutiny, as the various end uses and processes involved should be taken into account. The presented figures for natural gas oil equivalents should be downgraded accordingly.
It can also be noted that of the six oil majors selected for examination Shell and Total are slowly progressing to gas majors, while their combined oil production peaked before 2004. It is difficult to reconcile current claims that an oil peak is far away and that global oil production will rise to meet an increasing demand, while the arrival of tight oil in the US has made but a small impact on the radical falling in the production of the six major oil companies analysed.
© John Busby 04 September 2016