Energy resources
Forecasting
When considering
quantities of oil the universally quoted unit of volume is the US barrel, which
is 42 US gallons, 35 Imperial gallons or 159 litres. For comparison it is common
to convert natural gas, coal and electrical units to their thermal equivalent in
barrels of oil (boe). Another common unit is the metric tonne of crude oil which is
equivalent to 7.33 barrels. When considering world production rates and the size
of global reserves the barrel is multiplied by 1000 million to become the
gigabarrel (Gb).
The production
life-cycle of an oil field follows a "Hubbert Curve" 5 ,
conceived by the late Dr. M King Hubbert of the Colorado School of Mines. After
development, production rises to a peak and then falls off. The area under the
curve represents the total production of the field and its overall monetary
value depends on the course of oil prices during its life-time. The production
cycle curves of the individual oil fields overlap to produce a world peak curve.
Some fields have passed their "Hubbert" peak and national reserves are dwindling. Forecasts as to when global oil production reaches its peak have tended to be pushed forward with new discoveries and improved technology. The development of hydraulic fracturing (fracking) in the US has added "unconventional" oil and gas to the petroleum vocabulary, with normal oil and gas as "conventional".
A conventional "all-oils" world production peak was reached in 2008 and has "plateaued" since then at around 30 Gb per annum. Fracking in the US has added another 3.43 Gb of unconventional oil to the combined world production, pushing an eventual oil peak further into the future. The arrival of peak oil, though delayed, is likely now to be the result of measures to reduce atmospheric pollution as governments give serious consideration to electrification of transport 9.
The inclusion of NGLs in the conventional oil production figures has caused some confusion. BP's figure of the "all-oils" production of 33.9 Gb in 2017 included 0.01 Gb of lease condensate, 0.76 Gb of synthetic crude oil (SCO), 1.70 Gb of US shale oil and 3.43 Gb of NGLs, leaving just 27.9 Gb of conventional crude oil.
Actually, according to BP 6, global "all-oils" production, including NGLs, rose to 28 Gb in 2003, to 29.3 Gb in 2004, to 29.6 Gb in 2005, to 29.8 Gb in 2006, fell to 29.7 Gb in 2007, rose to 29.9 Gb in 2008, which may be the first peak as it fell markedly thereafter to 29.2 Gb in 2009, a radical decrease of -2.6%, rising slightly to 30.0 Gb in 2010, but markedly to 30.7 Gb in 2011, to 31.4 Gb in 2012 to 31.7 Gb in 2013, to 32.4 Gb in 2014, to 33.5 Gb in 2015, to 33.6 Gb in 2016 and to 33.9 Gb in 2017 and to 34.6 Gb in 2018 with the contribution from US unconventional shale oil from 2010.
The moderate rises in production up to 2008 were a response to surging crude oil prices, stimulated by economic growth in China and India. Then, for the first time, in 2009 global crude oil production fell markedly by 2.6% to just below 29.2 Gb (79,948 thousand b/day). It had been anticipated that in 2009 global oil production had reached a plateau and would begin its descent in 2010.
The US Energy Information Administration publishes its International Energy Statistics annually and provides an alternative set of figures. With the contribution of the US's shale oil, EIA's published statistics for "crude oil, NGLs and other liquids" and "crude oil, including lease condensate" show an increase from 2010 to 2016 of 9.6% and 9.2% respectively.
For comparison both production figures are shown in the plot below as Figure 1.
The plot shows the over 9% rise in oil production from 2010 with the addition of the unconventional production in the US, with the possibility that another peak may be reached after 2017 as the production in 2016 rose just 0.5% over 2015.
NGLs
Natural gas liquids (NGLs) and lease condensate are separated from natural gas.
NGLs are naturally occurring elements found in natural gas, and include propane, butane and ethane, among others. NGLs are valuable as separate products and it is therefore profitable to remove them from the natural gas. The liquids are first extracted from the natural gas and later separated into different components. The incorporation of natural gas liquids (NGLs) in an "all-oils" figure is not legitimate because they are sold separately in pressurised containers.
Lease condensate is a mixture consisting primarily of hydrocarbons heavier than pentanes that is recovered as a liquid from natural gas in lease separation facilities. Its addition to crude oil production figures is legitimate.
Ethane used in ethylene manufacture is a component of NGLs, though in gaseous form.
Oil price reduction
It is clear that conventional crude oil production peaked around 2008, while rises in production since then can be attributed to the inclusion of NGLs and unconventional oil. Towards the end of 2014, a drop in demand and the refusal of OPEC to reduce production led to a radical drop in the oil price. The consequences of this may well curtail exploration in areas of high-cost extraction, which may or may not include the US tight oil. In 2017 the "glut" was eased and prices rose, restoring somewhat drilling in oil shales.
Oil Majors
Comparing BP's 2014 annual statistics with previous versions shows that there is a tendency to retrospectively change past figures. Also BP relies on data from primary official sources in the public domain. So for comparison an analysis of figures published in the audited annual reports of six Western oil majors from 2004 to 2016 has been performed. See "Trends of 6 Oil Majors"
The analysis tabulates the oil and gas production of BP, ExxonMobil, Chevron, ConocoPhillips, Shell and Total from 2004 to 2016, then tabulates the aggregate figures of the six. The combined figures are then presented in a plot, Figure 1a
The combined oil production of the six comprises only 11% of world production, but the six are the top Western producers and their combined oil production is lower by 12% than in 2004, though rising somewhat since 2014.
Saudi Arabia
Saudi Arabia "all-oils" production (including NGLs) was up over that in 2015 of 11,986 b/d to that in 2016 of 12,349 b/d, a small increase of 1.0%. However, if the rising internal consumption is subtracted from the production, there was a decrease in exported crude oil in 2016 over that in 2005 of 5.3% Saudi net oil exports were 8,443 b/d in 2016, 6.7% below the level in 2005 of 8.918 b/d.
See the plot below as Figure 2.
The plot above indicates that Saudi Arabia's ability to fill world production deficits as a "swing" producer has come to an end. Because its internal demand continues to rise, its net exports are in decline. Population is rising in Saudi Arabia which has resulted in 32% of its oil production being consumed internally. Even if the rise in its oil production is actual, the net exports peaked in 2005.
However, in retrospect at the end of 2016 it will be interesting to see what the effect of OPEC's policy of maintaining its oil production will result. It hoped to bankrupt its fracking rivals in the US by failing to take into account reducing demand and bringing the crude oil price down to a level making the fracking for oil uneconomic for some wells. This worked to a certain extent as the US oil and gas sector has huge debt.
Reserves/Production ratios (R/P)
The amount of oil in a field able to be exploited economically is estimated from geological surveys and estimates based on test boreholes. Experience and expertise is exercised to produce a figure for "proved" reserves, being the amount remaining in the ground likely to be economically exploited. The significance of the oil reserves to production (R/P) ratio is that if production continued at its current rate the reserves would be empty when the number of years elapsed equals the ratio. This ratio is used by the oil industry as an indicator of the comparative sizes of country reserves and their future potential. However, the monitoring of actual production figures and plotting them on a cumulative basis provides a better indication of the likely ultimate production from a particular country.
Peak oil
Until April 2009 The Association for the Study of Peak Oil and Gas (ASPO) published a monthly newsletter 18 in which it provided a plot of global oil production from 1930, while extrapolating the trends of the various types of production until 2050. The ASPO plot comprehensively takes into account the likely contribution from regular oil, heavy oil and tarsands, that from deepwater and polar exploration and gas liquids. The global production peak in regular (conventional) oil is considered by ASPO to have already occurred in 2005.
Since then the Canadian tarsands have opened and in the US "fracking" has exploited "tight" oil in shale. The "end" of the financial crisis in the US has resulted in its oil consumption rising by just 0.5% in 2014 over 2013. Indigenous oil production has risen by 15.3%, so that in 2014 61% of its needs were met internally instead of 53% in 2013. The un-upgraded tarsands bitumen is diluted and pumped as 'dilbit" to US refineries to augment feedstock. The mined bitumen is running down and production is moving to "in situ" extraction which requires considerable natural gas. The tight oil from shale is unlikely to last for long in spite of claims to the contrary. The drilling activity is attracted to "sweet spots" and other locations may not be so productive, while in any case all well production falls off rapidly.
The combination of
the global financial crisis and the unconventional oil has delayed the onset of
peak oil. The high oil price has had a deleterious effect on the world’s economies,
particularly the USA which depends on oil for its lifestyle, while giving
incentive to unconventional oil extraction. However, the claims that oil
production is rising in the recently issued statistics of BP, EIA and IEA are
difficult to believe while the upstream oil production of the Western oil majors is
sinking so fast.
In 2015 OPEC took advantage of falling demand to create a large fall in the oil price by maintaining production. This has reduced the drill rig count in the shale plays in the US, but the full effect on the world's economies will not be evident for some time. Consumers are benefiting from low oil product prices, but the oil companies will have reduced profits, while exploration companies are reducing staff levels.
BP and BP's St
R/P ratios
BP publishes
annually a "Statistical Review of World Energy" 6 on its
web site which includes a downloadable spreadsheet giving detailed
information on the world's oil, natural gas and coal reserves, production and
consumption. The first worksheet
“Oil-Proved reserves” gives proved reserves and R/P ratios
(reserves/production) for every producing country and for
the world.
The 2001 review gave an R/P peak ratio of 44 for 1990 reducing to 40 by the end of 2000. At the end of 2002 the R/P ratio had reduced further to 39, to rise to 41 at the end of 2003, dropping back to 40.5 at the end of 2004, shown at 40.6 at the end of 2005, slightly down at 40.5 at the end of 2006, but up again to 41.6 at the end of 2007 and at 42.0 at the end of 2008. By the end of 2009 it was back up to 45.7, then 46.2 by the end of 2010, 54.2 at the end of 2011, 52.9 at the end of 2012, 53.3 at the end of 2013 and 52.5 at th eend of 2014. Assuming flat production, the end of oil was in BP's view in 1990 not until 2034 and in 2014 not until 2066.
Although discoveries are consistently much less than the production drawn from the reserves, the global R/P ratio has been claimed above 40 since the turn of the century. However, if the aggregate of the six major Western oil companies is taken, the R/P ratio at the end of 2014 for their oil was only 15.9, while individually that for BP was 14.0 and for Shell it was only 11.3.
Although featuring
in reviews annually, the R/P concept used
by the industry is flawed. Production will not continue to the end of the
period defined by the ratio at a rate current at the time of the calculation and
then suddenly fall to zero as a step change. It is however a useful guide for
comparing one country's reserves in terms of its production rate with another,
always providing that the reserves are not overstated.
For example, the
Russian Federation is expending its reserves at a rate yielding an R/P ratio of
only 26.1, whereas Saudi Arabia’s fields, if its reserves are of the size
claimed, have an R/P ratio of 63.6. The Russian excessive rate of production
offers a challenge to the production limitation policy of OPEC, but means that
the Federation’s oil will dry up prematurely.
Proved reserves
For the preparation of the 2015 annual statistical review for a period to end-2014, BP relied on data from primary official sources, the OPEC Secretariat, World Oil, O&GJ and an independent assessment of Russian reserves, but added reservations as to the accuracy of the data in the small print. The figure of 17001.1 Gb for proved oil reserves includes gas condensates, natural gas liquids and around 166.3 Gb for Canadian oilsands of which 24.4 Gb are deemed "under active development". BP gave a figure of 1046.4 Gb for the end of 2000, which would mean that the reserves have been up-rated by 59.7% in 14 years.
It had been hoped that oilsands and oil shales, the so-called unconventional oils would provide huge additional reserves in great quantities for the future. In the event the contribution from oilsands is proving to be minimal. However, the oil shales have provided a significant contribution to the US oil production, albeit the 'tight' oil obtained by fracking in the Bakken and Eagle Ford plays is likely to prove ephemeral.
In BP's successive statistical reviews there is a backward revision in the worksheet "Oil - proved reserves history" of the previous few years reserves' figures, smoothing out the unexplained additions in past years.
BP oil policy
Rosneft has taken over TNK-BNP in a $55bn (£36bn) deal that will make the Russian state-owned oil company by far the world's largest listed oil producer. The deal will see BP collect $16.7bn in cash and a 12.5% stake in Rosneft in return for its 50% stake in the TNK-BP venture. The deal takes BP's stake in Rosneft to 19.75%, and BP will get two seats on the Russian company's board.
BP is also involved in a crude oil pipeline project from Baku, the capital of Azerbaijan on the West shore of the Caspian Sea through Georgia and Turkey to a terminal at Ceyhan on its Mediterranean coast. The pipeline is designed to pump 1 million barrels per day (50 million tonnes/year).
BP and peak oil
BP does not expect an imminent peak in world oil production, but acknowledges that there is a core of informed analysts who do believe in such an outcome. In defence of the "peak" analysts, production in the United States peaked in 1970, North Sea oil peaked in 1999, since when the UK remains in decline, while the fracking of 'tight' oil has stemmed the US decline, but is far from restoring the production at the 1970 peak. The aggregate of similar production profiles from the world's oil fields produces a unified global peak in production. Once this is past, only a major discovery could produce a subsequent revival of production and a steady decline ensues. ASPO reckons that "regular" or conventional oil passed its production peak in 2005, while the anticipated "all-oils" peak appeared to be nigh in 2011 as global production figures plateaued since 2005, but showed a small rise in 2011, 2012, 2013 and 2014.
Alberta's AER (was ERCB) st98 annual reports
Alberta's upgraded bitumen or synthetic crude oil (SCO) production in 2004 was 219 million barrels, falling to 200 million barrels in 2005, rising somewhat in 2006 to 240 mb, to 251 mb in 2007 but falling to 239 mb in 2008, rising to 279 mb in 2009, to 290 mb in 2010, to 315 mb in 2011, to 329 mb in 2012, 342 mb in 2013 and just 346 million barrels in 2014.
Bitumen extraction was 399 mb in 2004, 388 mb in 2005, rising to 458 mb in 2006, to 482 mb in 2007, but falling by 1% to 477 mb in 2008, but rising to 544 mb in 2009 and 589 million barrels in 2010, 637 million barrels in 2011, 705 million barrels in 2012, 761 million barrels in 2013 and 842 million barrels in 2014.
In aggregate SCO production in Alberta has risen a mere 4.7% per annum over 10 years, while over the same period bitumen production rose at 7.8% p.a. At 0.346 Gb production in 2014, Albertan SCO provided but 1.07% of world crude oil production. Only around 40% of the bitumen produced is currently upgraded to SCO and as there is currently no project to increase the upgrading capacity, as bitumen production increases SCO production will not.
Canadian un-upgraded bitumen is diluted with pentanes (imported from the US) for exporting to the US as 'dilbit' by pipeline as feedstock for US refineries, but for this to increase in volume it needs the Keystone XL pipeline to be built, the incentive for which is affected by the arrival of the 'tight' oil in North Dakota, which is of good quality and needs no upgrading. Instead the Canadian government is investigating a West-East pipeline to transport diluted bitumen to Eastern Canadian refineries
UK reserves
British indigenous oil reserves, which comprise only 0.2% of the global total, are currently under the North Sea and at other not yet explored locations on the continental shelf. UK oil production passed its peak in 1999 of 2930 b/d and in 2014 was only 850 b/d, tailing off 71% in thirteen years.
It would have been better to
have left
the now extracted reserves where they were for later in the
century when foreign oil resources will be exhausted.
The oil companies viewed their principle business as finding and exploiting oil and gas resources and indeed their main profit base was exploration and production rather than refining and distribution. The trend now is to acquire shares in established production companies, such as those in the Former Soviet Union. It must be assumed that little can be done to avoid the depletion of British reserves, which culminated in the net importation of oil in 2014 of 68% of its consumption, even though consumption has fallen by 15.8% since 2005, from 1806 b/d then, to 1520 b/d in 2014.
Global reserves
According to successive BP statistical reviews, with new discoveries (less interim production), global reserves rose by around 139 Gb over the period 1993-2003 from 1009 Gb in 1993 to 1148 Gb in 2003, with the biggest rise over 2003 of 100 Gb. The principle contributions to this rise, subtracting the individual countries' reserve figures for 2002 from those for 2003, are as follows:-
Table 1
| Canadian oilsands | 16.9 - 6.9 | 10.0 Gb |
| Iran | 130.7 - 89.7 | 41.0 Gb |
| Nigeria | 34.3 - 24.0 | 10.3 Gb |
| Russia | 69.1 - 60.0 | 9.1 Gb |
| Libya | 36.0 - 29.5 | 6.5 Gb |
| China | 23.7 - 18.3 | 5.4 Gb |
| Brazil | 10.6 - 8.3 | 2.3 Gb |
| Australia | 4.4 - 3.5 | 0.9 Gb |
| Smaller increments | 14.5 Gb | |
| Total | 100 Gb |
In BP's Statistical Review 2015 the global proved reserves claimed at the end of 2014 are virtually the same as in 2013 at 1700.1 Gb and 1701.0 Gb respectively. From the end of 2003 in spite of withdrawals of of 285.8 Gb in the 11 years, the reserves rose from 1343.2 Gb at the end of 2003 to 1700.1 Gb at the end of 2014, a rise of 356.5 Gb, So discoveries of around 675 Gb are claimed.
Unexplained increments
The above analysis of proved reserves is based on BP's figures, but they in turn are based on a variety of sources and cannot be confirmed unreservedly by BP. In the 1980's statistics there appeared step increases in OPEC countries' reserve figures, originating from the Oil and Gas Journal which published the figures without question. There is no intimation of how the upgraded figures were derived.
OPEC’s quotas are based on a country’s capacity to produce, the demand for its oil and most significantly the size of its reserves. In the 1980’s the six major producers in OPEC declared significant increases in their proven reserves. In 1984 Kuwait upped its proven reserves by 39%; in 1987 Iran raised its by 90%, Iraq its by 112%, the Emirates raised its by 196% and Venezuela its by 125%; in 1989 Saudi Arabia raised its by 50%, presumably to enable their agreed quotas to be increased. 17 The effect of these adjustments was to increase the stated amount of the global proven oil reserves at that time by 303 Gb, i.e., by 45%.
It is now thought that these upwards adjustments in the 1980's were to establish a country's ultimate oil recovery, rather than show the remaining reserves. It is not clear on what the step changes are based; whether they are based on new discoveries or on a re-appraisal of previous estimates. The claimed national reserves deserve more analysis, since if the additions were political rather than actual, then the world's proved oil reserves are overstated.
Middle East predominance
The Russian Federation's proven reserves have changed from 75.5 Gb at the end of 2005 to 103.2 Gb at the end of 2014. In the interim some 39 Gb of oil was produced, so that claimed discoveries amount to 66 Gb. With current production of 3.88 Gb/annum, the R/P ratio is 26.1. The Russian Federation produces more in proportion to its share of global reserves than the Middle East countries and must soon realise that its own economy will need the oil it is currently exporting.
From the 2015 BP statistical review, 47.7% of the world’s proven oil reserves reside in the Middle East, of which 15.7% are in Saudi Arabia, 9.3% in Iran, 8.8% in Iraq and 6.0% in Kuwait. At 2014 production rates (and if the reserves are as stated, which is doubtful) Middle East oil has 78 years to run. With the plunge in the oil price at the end of 2014, demands are being made for the Middle East, in particular Saudi Arabia, to decrease production to restore the viability of non-OPEC production. This has been denied, but in any case net exports from Saudi Arabia are in decline as domestic consumption rises.
As a consequence of world recession, demand in 2009 slackened, but rose by 8.2% in 2014 over 2009. Restored growth in the global economy will need Middle East production to increase - but as can be seen from the plot Figure 2, due to its rising internal demand the ability of Saudi Arabia to "swing" production to pump enough oil to satisfy the rising economic aspirations of China and India has been lost - and such aspirations are unlikely to be fulfilled. However, China and India are reducing their demand and there are demands now for the "swing" to work in the opposite direction.
Reducing demand is a factor in the passing of peak oil - as reserves empty rising oil prices will reduce consumption and delay its passing.
Political factors
As conventional oil production has passed its peak, the OPEC practice of maintaining oil prices by the control of supply and the moderating effect of Russian oil exports can be discounted. The rise, perhaps temporary, of unconventional oil in the US has reduced its need for importation.
All the
above named Middle East countries, with the exception since 2003 of Iraq, are autarchies and are the targets of Islamic
fundamentalists.
This will set the world in deadly
competition with the USA for oil supplies. As the consumer of 21% of the
world’s production, importing 39% of its requirement, the USA’s procurement of its oil will be met either by
paying a premium or secured by military intervention.
Severe economic distress is affecting many nations, exacerbated by irresponsible banking practice. The problems in the US in the autumn of 2007 were blamed on a "sub-prime" mortgage market, but an inability to travel to the suburbs cheaply may well have caused the value of houses to decline. The high price of US gasoline also meant that over-engined vehicles failed to sell, reducing employment in Detroit and the ability of workers to pay their mortgages. In 2014 high oil prices had a significant impact on daily life, but in mid-year end there was a sudden fall in the oil price by the second half of 2015 has more than halved. It was attributed to the reduction in economic growth of China and India and due to the reluctance of Saudi Arabia to cut its production. The reduction in US imports from 14,061 1000 b/d (5.13 Gb) in 2006 down to 7391 1000 b/d (2.70 Gb) in 2014 will also have contributed to the fall.
The
reliance on oil and associated natural gas is not confined to transport and
heating fuels, but to almost all aspects of modern life. Oil and gas is the
source of plastics and resins, synthetic fibres and rubbers, detergents,
dyestuffs and agro-chemicals.
US policy
In the United States
oil reserves at the end of 2014 rose by 13.5 Gb to 48.5 Gb from 35.0 Gb at the end 2010, taking into
account the tight oil reserves. Peak production in 1971/2 was 4.1 Gb. In 2014
production was 4.25 Gb, so that its previous peak has been exceeded. Its consumption in
2014 was 6.94 Gb but it was still a net importer with 30% of its requirements met by external suppliers.
In 2002 and 2003 the USA focused its attentions on the Iraqi regime and its capability in weapons of mass destruction, leading to the second Gulf War in 2003. Detractors maintained that the real aim of the USA was the procurement of Iraq's oil, which in national oil reserves ranks third in size. This view was supported by the coalition priorities after the war, when some of the oil production was restored and an end to UN sanctions was sought and obtained. Fields in Iraq have now opened up to foreign investment.
Tight oil
An ephemeral glut of natural gas arose by the application of hydraulic fracturing (fracking) of shale gas in several US states. So much gas was originally produced that the price fell to $2 a thousand cubic feet (or Mcf virtually equivalent to a million BTU or MMBTU), while the extraction cost is around $8 per Mcf.
Although lost, the initial investment in equipment has been rewarded by moving the action to frack oil-bearing shales in the Bakken and Eagle Ford plays in North Dakota and Texas. The tight oil obtained is of a high quality and in great quantities. This, with a fall in consumption, has changed the ratio of imported crude oil to that internally consumed from around 67% in 2006 down to 30% in 2014.
The current production is from the most prolific areas in the plays, but like gas it falls off rapidly in the first few months and is likely to be just as ephemeral as fracking for gas. The foreign companies involved have sustained huge financial losses. BHP Billiton, BP, BG and Statoil lost together $10 billion fracking for gas, while Shell has lost $2.1 billion fracking for oil.
The action has moved from fracking for "dry" gas, to "wet" gas with NGLs and condensate and to "tight" oil, with enhanced revenues.
UK
How will all this
affect us?
· UK oil reserves fell progressively from 5.0 Gb in 2000 to 4.9 Gb in 2001 to 4.7 Gb in 2002 , to 4.5 Gb in 2003 and in 2004, to 3.9 Gb at the end of 2005 and 2006, then to 3.6 Gb at the end of 2007, at the end of 2008 to 3.1 Gb, at the end of 2009 and of 2010 to 2.8 Gb. but rising to 3.1 Gb at the end of 2011 and 2012, but ending at 3.0 Gb at the end of 2013 and 2014. This contrasted with claims that Scotland held 24 Gboe "in-place" in its waters during the Scottish independence referendum. From 2015 to 2018 the reserves were estimated as just 2.5 Gb.
·
The R/P
ratio was 6.3 over 2018.
·
Production
fell from 1.07 Gb in 1999 to to 310 million barrels in 2014 showing
that the Hubbert production peak was passed in 1999 heralding the start of a
downwards trend, but rising by 12% from 351 million barrels in 2015 to 396
million barrels in 2018.
·
Internal
consumption over 2014 was 590 million barrels which was 49% above UK production, so we are
still dependent on imports of oil.
Forecasting
BP Statistical
Review 2019 provides the figures used below for the analysis of gas reserves and production. The distribution of
gas reserves does not correspond with the occurrences of oil. The countries of
the Former Soviet Union hold 31.9% of the world's gas, of which the Russian
Federation holds 18.9%, the Middle East 38.4%, Asia/Pacific 9.2%, Africa 7.3% each,
North America 7.1%, South and Central America 4.12% and Europe a mere
2%, of which the UK holds a minimal 0.2%! Of the current 43% of the world’s
gas reserves in the Middle East, 18% are in Iran, 13% in Qatar, 4% in Saudi
Arabia, 2% in Iraq and 1% in Kuwait.
World gas production in 2018 was 3.87 trillion cubic metres (tcm), equivalent to 22.8 Gb of oil (Gboe). Reserves of natural gas at the end of 2014 were 186.5 trillion cubic metres or 1230 Gb oil equivalent.
Since natural gas reserves were estimated in 2000 at 154.3 tcm, twelve years later, by the end of 2014 some 41 tcm had been extracted, leaving reserves of 186.5 tcm, so that some 41 + 31 = 72 tcm of reserves addition has been assumed. This represents an average exponential annual growth in consumption of 2.5%.
Peak gas
BP cited a world gas R/P ratio at the end of 2014 of 54.1, compared to 52.5 for oil. At 2014 production rates, gas reserves would provide a source of energy for a further 2 years after oil exhaustion, i.e., in 2070. The reserves/current production ratio is however of little use in considering the "bell-shaped" production curve exhibited by extraction rates from individual reserves.
The combined upstream oil production from the Western oil majors is in decline and as their production runs down more will be drawn from gas reserves in substitution. If gas production can be raised to match the run down of oil production, gas will deplete more rapidly.
World natural gas production rose 1.6% in 2014 over 2013.
Shale Gas
Much has been made of the extraction of gas from shale "plays" in the US by means of "fracking" (fracturing) using high pressure water with chemicals and "proppant" (mostly sand) used to prevent the fractures from closing.
Agencies seem unaware of the problem of dealing with the wastewater
"flowback" and produced water, for which in the UK there is currently no
means of disposal.
In the US the flowback and produced water goes into open pits, called
"impoundments" as can be seen in the 2000+ aerial views on www.marcellus-shale.us
The open pits have been a major health hazard with the petroleum and toxic
vapours emitted from them. Some have leaked.
With some the contents are sent to treatment works, while with others the contents have been injected untreated in deep boreholes. In the UK open pits are prohibited and double-skinned tanks are required, nor is injection into boreholes permitted.
At Preese Hall in Lancashire Cuadrilla collected the wastewater from its
fracking in double-skinned tanks to contain the toxins and
naturally-occurring radioactive materials (NORM) in it. It was then transferred to
United Utilities Davyhulme treatment works by 300+ road tanker journeys, from
where it ended up in the Manchester Ship Canal and the Mersey Estuary.
Unfortunately the treatment process concentrates the toxins and the NORM in the
de-watered sludge and in some cases it has to go to a low level radioactive
repository like Drigg. In the US the sludge is tested for radioactivity to
decide to which landfill it is to go. The other major problem is that the de-sludged
water is unacceptably saline for disposal in water courses. It is too saline to be treated
with reverse osmosis. This is in case energy intensive and expensive in modules, which may
also have to go to radioactive landfill. An alternative is mechanical vapour
compression to recover some clean water, but the residue is then even more
concentrated and more difficult to dispose.
Also the treatment plant equipment is
scaled up with radioactive deposits and a process line dedicated to treating fracking
wastewater would be required.
United Utilities has declined to obtain a permit for further fracking wastewater
and currently, although three treatment works have been nominated, none have a
permit. The Environment Agency's problem is that every well return water is unique and has to
be tested for its content before a permit for it to be treated can be issued.
The government will try to ameliorate the effect of the current regulations,
because it is clear that fracking for gas will be uneconomic with their
adherence. The prospectors are looking for more profitably fracked oil, but as
the gas content with the oil will be the lesser content it will be insufficient
to justify a pipeline for the relatively short production time of the wells and
there will be constant flaring.
In the US some states are banning open pits and there are limited numbers of
suitably classed boreholes to take undiluted wastewater and there is much opposition to new fracking
operations.
Each new well planning application will be vigorously opposed and as full exploitation
in the UK will require 20,000 to 50,000 wells the policing costs will be
monstrous. Fracking will be tied up, not with red tape, but by the nature of its
operation.
With the North Sea nearly empty it will be tempting for the government to ruin
the countryside for short-term gain, but it may not happen in the UK. The
US experience has been too bad as shown in the Marcellus Shale website. The
township of Denton in Texas has banned fracking within its boundaries, but the
governor reversed the ban and local democracy has been denied.
Liquefied natural gas
Because of the
nature of gas it requires pressure pipelines for overland transmission or
pre-processing to liquefied natural gas (LNG) for ship transport, in comparison
to crude oil which can be loaded directly to ocean tankers and transported for
processing at the consumer country.
An example of an LNG venture is the Sakhalin Island project off Eastern Siberia developed by a consortium of Shell, Mitsui and Mitsubishi. Oil and gas from off-shore platforms to the North of the island are pipelined for 800 km, the whole length of the island, to an ice-free port in the South, where an oil export terminal and gas liquefaction plant has been built. The frozen gas is exported in special ships to Japan, Korea and China.
As a further
example, Exxon/Mobil is liquefying and shipping LNG from Qatar in the Gulf to
Asia, it being uneconomic to ship to America.
Gas substitution for
oil
As oil reserves
exhaust, world markets will turn to exploit the potential source of chemicals
and liquid fuels in natural gas. In anticipation of this the oil and gas
industries have invested in processes able to convert remote natural gas
resources into liquid products, the so-called Gas-to-Liquid technology.
For example, BP is a partner in the Atlas Methanol Company (36.0%) in a 2.5 million tonnes/annum gas-to-methanol plant in Trinidad. This has opened up an alternative route for chemicals to that of petrochemicals. In 2003 BP commissioned a 300 b/day pilot plant in Nikiski, Alaska able convert gas to synthetic diesel, jet fuel, naphtha and synthetic lube stock. Apparently it was not thermally efficient, as BP has no plans for further local development in Alaska.
The new processes
able to make liquid fuels will have to be sited on the gas fields to be
economic. If in spite of this disadvantage, production rises to meet a demand
for liquid fuels not provided by oil, the 2014 aggregate world gas R/P ratio of
54.1 could well reduce to match that for oil of 52.5, so that although gas has a
potentially longer life, this may shorten due to market equilibration. (See
Section 5 - Table 2 and Figure 3 below)
The conversion thermal efficiency of gas-to-liquids processes is theoretically only 55%, which will be lower in practice. Oil equivalents are calculated on a comparison of the heating values of crude oil and natural gas, but dependent on the efficiency of the exploitation technology, the oil equivalents should be downgraded accordingly. The equivalent figure used varies depending on the composition of the oil and gas, but BP assumes in its 2015 statistical review that 1 thousand cm of natural gas is equivalent to 6.60 barrels of crude oil, though in the 2000 to 2008 Statistical Reviews it was given as 6.29 boe.
In the oil majors annual reports, reserve replacement ratios are boosted by assuming overstated oil equivalents for gas, which should be reduced, dependent on the end use of the gas.
Location of gas fields and markets
The three countries of North America share a network of pipelines supplying it with 26.9% of global natural gas production. This is currently drawn from gas fields on the continent itself, but with an indigenous gas depletion rate of around 8%/annum, terminals for importing LNG were built. The employment of new technology for extracting gas from shales reduced the US dependence on imported LNG to 4.3% in 2014, probably to nothing in 2015.
Russia consumed 71% of its gas production in 2014, which peaked in 2011 and which fell by 4.7% in 2014. Domestic consumption decreased by 3.6% over the same period, 2011 to 2014. World gas consumption increased by a moderate 0.4% in 2014 over 2013, while North, Central, South America and Asia Pacific increased gas consumption, while Europe, Eurasia and Africa decreased gas consumption.
So although the EU continues to be supplied from pipelines from Russia, it will have be augmented with Algerian and Libyan LNG by ship. The UK will be at the penultimate end of the pipeline from Russia, which may mean that if there is a shortage in Europe, it will be severely disadvantaged. Only Ireland is more unfortunately placed! Prior to the exploitation of shale gas, for the augmentation of its indigenous gas, North America placed reliance on plans for LNG supplies from Eastern Russia, Africa, Qatar, Indonesia and Western Australia.
The remoteness of markets from the gas fields means that a large number of gas ships will be required to maintain supplies and due to the warming of the liquefied gas during the shipment, gas has to be released into the atmosphere during the journey to avoid an over-pressure in the insulated tanks. For shipments to the USA or Europe from Australia or the Gulf, losses of around 4% - 6% can be expected. However, some of the gas otherwise vented to the atmosphere can be used to propel the ship. Korea and Japan expect to benefit mostly from the Sakhalin project and being neighbouring countries will enjoy a cost advantage over the USA.
Although the liquefaction of the gas enables use to be made of "stranded" gas, remote from its markets, there is a loss of energy amounting to around 15% of the raw gas feed, depending on the impurities in the gas which have to be removed before liquefaction and the distance it has to be transported. The feed gas may contain CO2 and H2S, the removal of which leaves the gas wet, so that before liquefaction it has to be dried. Propane, butane and pentane are removed by fractionation leaving ethane and methane to be liquefied. The propane and butane are stored and shipped in separate tanks, while the pentane is injected into crude oil (if it occurs with the gas).
It may be that some of the remotely occurring gas will be converted to liquid fuels in Gas-to-Liquids plants adjacent to the gas fields in an attempt to ameliorate the shortfall in crude oil feedstock. The problem will be to decide whether it will be more viable to convert the gas to liquid fuels able to be shipped in normal oil tankers or liquefy it for shipping in special LNG tankers to an unloading terminal for re-gasification and addition to a gas supply network.
Towards the end of 2002, a Russian gas company Gazprom announced that it was seeking finance to lay a new gas pipeline under the Baltic Sea to Germany, Holland and Britain, supporting this project with the statement that "Britain is set to become a net gas importer after 2005". This forecast turned out to be true and in July 2005, the first LNG gas tanker from Algeria arrived at the Isle of Grain in the Thames, while in 2009 in Milford Haven two LNG regasification terminals were opened. Piipelines from continental Europe and Norway are also now in use.
A 1,222 kilometres Nord Stream gas pipeline was built from Vyborg in Russia to Greifswald in Germany and was inaugurated in 2011, followed by a parallel pipeline in 2012
UK gas reserves fell from
0.74 trillion cubic metres in 2000 to 0.66 tcm in 2001, to 0.63 tcm
in 2002, to
0.59 tcm by the end of 2003, to 0.53 tcm by the end of 2004, to 0.48 tcm by the end of 2005 and of
2006, to 0.41 tcm by the end of 2007, to 0.34 tcm by the end of 2008, to 0.29
tcm by the end of 2009, to 0.25 tcm by the end of 2010, to 0.20 tcm by the end
of 2011, 2012, 2013 and 2014. The UK Hubbert peak for natural gas was passed in 2000.
The production of 36.6 billion cubic metres in 2014 was insufficient to cover internal consumption of 66.7 billion cubic metres. The UK's gas consumption peaked in 2008 at 93.8 bcm. From 2005 the UK has been a net gas importer, in 2014 importing 45.1% of its needs.
"The Limits to Growth" 1 main finding was the reduction in the efficiency of capital as resources become leaner and scarcer. The exhaustion of the conventional oil reserves will mean that liquid fuels will become increasingly expensive and beyond the reach of developing nations. It is the breakdown in economic activity associated with a failure to replenish capital that brings the global crisis and the key economic activity of transport will be of the utmost significance.
Liquid fuels are the principle source of motive power for transport, so alternative sources for petrol, diesel and jet fuel are required or other means of propulsion must be developed.
Unconventional oil
It is argued that as reserves of conventional oil run down, more use will be made of "unconventional" oil extracted from oil shale (kerogen), shale oil (aka tight oil) and oilsands (aka tarsands) and occurrences of heavy oil.
Oil shale (Kerogen)
When heated some types of kerogen release crude oil or natural gas. For example, at one time there was a motive fuel industry in Scotland based on shale oil, but that is long gone. At one time reddish slag heaps created by the extraction could be seen when driving from Glasgow to Edinburgh. There are large shale oil deposits, especially in the United States, but also in Australia. Unfortunately the extraction process is so complex that there is a very limited energy gain (in practice none) and it presents a waste disposal problem. In 2003 an oil shale venture in Australia, called Southern Pacific, failed due to the high costs of production.
Shale oil (aka tight oil)
Shale oil, also known as tight oil or light tight oil (LTO) consists of light crude oil contained in shale or tight sandstone. Production of shale oil requires hydraulic fracturing (fracking) and horizontal well technology as used in the production of shale gas. It should not be confused with oil shale which is rich in kerogen.
Fracking for natural gas in the US in 2014 accounted for 45% of total natural gas production, but involved huge financial losses for the investors. Also individual well production falls off rapidly, so the drilling rigs moved from so-called "dry" gas to drill for "wet" gas rich in natural gas liquids (NGLs) and for tight oil, mostly in the Bakken plays (both sides of the US and Canadian border) and the Eagle Ford plays in Texas.
Over 2014 tight oil production amounted to around 1.4 Gb to 1.5 Gb, contributing around 22% of the US oil consumption of 6.9 Gb in that year. Its advantage is its high quality. It has set back Canadian investment in process equipment for upgrading the half of un-upgraded bitumen from the oilsands and delayed a decision on the Keystone XL pipeline for export of diluted bitumen "dilbit" to US refineries.
Tight oil production has risen rapidly, but the drilling activity has been primarily in the most productive plays and individual well production, as is the case for fracking for natural gas, falls off rapidly. In 2014 overall US oil production matched the 1970 peak in production, but as well production falls off when drilling outside the best areas this may change.
The other problem is that in oil rich wells the associated natural gas and the more volatile NGLs are insufficient in quantity to justify the building of pipelines and are simply flared. Because of the fall-off in production, the flaring will continue to be a problem and there will be little retroactive pipeline construction.
It means that the tight oil "revolution" may not be the "game changer" imagined in the long term.
Oilsands (aka Tarsands)
The source of information on the oilsands is the Albertan AER's annual st98 report.
At least 85% of the world's natural bitumen occurs in the Canadian province of Alberta where there are huge oilsands, which it is claimed, amount to reserves of 1845 Gb of oil. The deposits consist of sands impregnated with bitumen, which mostly are exploited by massive excavation of the overburden followed by steam or hot water separation of bitumen from the sand, the tailings from which fill huge ponds.
For deposits which are under 50 metres of overburden in-situ techniques of slant drilling are employed. These allow steam injection from horizontal pipes into the oilsands deposits to liquefy the bitumen for recovery through a second pipe returning to the surface. Natural gas is also injected to reduce the gravity of the bitumen as an aid to uplifting it in the product pipe. This is known as Steam-assisted Gravity Drainage (SAGD) and is being applied in several locations.
The bitumen from mining or SAGD has then to be diluted for pumping to a refinery which has been extended to pre-process the bitumen, where it is hydrogenated and desulphurised to form a "sweet" synthetic crude oil (SCO) for normal refining into products. Only half of the bitumen is processed to SCO in Canada. The non-upgraded bitumen is diluted with pentanes and pipelined to refineries in the US where it is blended with normal crude oil. There are plans to extend the Keystone XL pipeline to transport diluted bitumen ("dilbit") to Texas refineries.
Extraction is costly and energy consuming. Further capital expenditure is underway and the natural gas used for steam raising, hot water heating and production of hydrogen is in demand for other uses, though the introduction of shale gas into the North American network is significant. The effect of the "tight" oil production from the Bakken shale plays has set back plans to build more upgrading capacity
Some may be sold as bitumen for road surfacing and other purposes.
Production of bitumen in 2009 was 0.544 Gb, rising in 2010 to 0.589 Gb, to 0.637 Gb in 2011, to 0.705 Gb in 2012, to 0.761 Gb, and to 0.842 Gb in 2014.
The Canadian annual production of extracted synthetic crude oil (now described as upgraded bitumen) rose from to 0.279 Gb in 2009 to 0.290 Gb in 2010 to 0.315 Gb in 2011, to 0.329 Gb in 2012, to 0.342 Gb in 2013 and to 0.346 Gb in 2014. The proportion of SCO extraction from the bitumen was 0.346/0.842*100 = 41% in 2014.
Un-upgraded bitumen is exported to the US as refinery feed. As
"railbit" it can be accommodated raw in railcars with heating coils or
when moderately diluted. As "dilbit" with around 30% diluent (mainly
pentanes) or, as "synbit" diluted with SCO, it can be pipelined South
over the border to the US. In Canada, the pentanes and other diluents used for internal transfers are
partially recovered
and returned to the oilsands for re-use. The Keystone XL pipeline if it is built
will augment the existing pipeline capacity of 400,000 barrels per day to
600,000 barrels per day.
It is estimated that 315 Gb of the 1845 Gb initial in-place resources are recoverable, but the yield will be limited by the amount of natural gas available. Of the energy in the synthetic crude oil produced by SAGD, 30% is required in the extraction and processing. If this energy is obtained solely from natural gas as it is at present, the recoverable 315 Gb of synthetic crude oil would consume 15.07 tm3 (trillion cubic metres) of natural gas.
However, the natural gas reserves in Canada total only 2.0 tm3, production having peaked in 2002 at 187.9 bm3 falling by 2014 at 162,0 bm3. Assuming that 20% of Canada’s remaining natural gas could be earmarked for oilsands synthetic crude oil extraction, i.e., 0.40 tm3 - only 8.4 Gb of synthetic crude oil could be extracted from the oilsands reserves, while consuming 30% of its oil equivalent in natural gas. This is around one year's crude oil consumption in the North American market - the USA, Canada and Mexico consumed 8.5 Gb in 2014.
As bitumen is exported to the US for refining it might also be considered that 10% of the US gas reserves be devoted to oilsands SCO production, in which case 0.98 tm3 of gas would mean that a total of around 22 Gb of SCO could be produced, providing about 3 years of US oil consumption.
The way forward may be to use more of the bitumen as a source of heat. Oxygen or air is injected into the oilsands layer to burn some of the bitumen in order to liquefy and bring other bitumen to the surface. There would still be the need for hot water for separation from the sand and for hydrogen (from methane) for upgrading to synthetic crude oil. This method is under development.
The cumulative production of bitumen over the period has amounted to around 9 Gb with around 4.5 Gb of SCO produced in Canada. The Oil & Gas Journal added 174 Gb from oilsands to the global proved oil reserves, but BP was less sanguine and included only 32.4 Gb in respect to oilsands in its 2012 figure for proved reserves of bitumen as of which 3.0 Gb being 'under active development'.
In
a refinery the hydrocarbon number of the bitumen is lowered to upper and middle
distillates by coking and hydrogenation. The coking process produces
accumulating quantities of petroleum coke (petcoke), which is mainly carbon with
vanadium and sulphur pollutants.
In
Alberta petcoke arises from the refineries in Edmonton and the US in refineries
in Texas and elsewhere. It can be sold for burning in power plants, for
augmenting coking coal and for carbon anodes for electrolysis, but it is
unpopular and stockpiles are growing. There are around 100 million short tons of
it in Alberta.
See "Canada's tarsands"
Heavy oils
Deposits of around 1200 Gb of bitumen and extra-heavy crude oil occur in Eastern Venezuela, North of the Orinoco River, of which around 270 Gb is considered to be recoverable. Bitumen is extracted from depths of 500 m to 1000 m by directional and horizontal drilling using screw pumps. To reduce its viscosity for pumping it has to be blended with a lighter oil diluent in order to be pipelined to the Orimulsion manufacturing plant, from where the diluent is separated and returned to the production field. Orimulsion is an emulsion of bitumen and water. It can be used in conventional power plants and could free some coal for liquefaction and manufacture of chemicals.
The extra-heavy oil can be upgraded to a lighter synthetic crude which can be used as refinery feedstock. Some energy is used in the upgrading, either by hydrogenation with hydrogen from natural gas or by heating for coking. Although the Venezuelan deposits are vast, the current production of upgraded crude oil is marginal at 100 million barrels per annum.
Limited contribution
It is anticipated that production of liquid fuels from unconventional oil will supplement falling production from conventional crude oil, securing supplies and sustaining continued growth in the global economy. From the above analysis of the oilsands and heavy oils it appears that such anticipation is unwarranted.
Synthesis from natural gas
But liquid fuels can be synthesised more readily from natural gas. Unfortunately a gas-to-liquids (GTL) plant suffers from a lack of efficiency in the extraction process compared to crude oil refining. Because of the loss of some of the hydrogen as water and some of the carbon as CO2, the process has a theoretical thermal efficiency of only 55%.
BP established a gas-to-liquids pilot plant at Nikiski in Alaska, which was successfully commissioned in 2003. There was a proposal to run a gas pipeline from Prudhoe Bay to the North American gas grid, to which presumably an enlarged plant would have tapped in, but the pipeline project was abandoned on economic grounds. There is a need to site the conversion plant on or near the gas field in cases where transportation of the gas to the markets cannot be performed by pipeline or shipped as liquefied natural gas, but siting the plant on the inhospitable North Slope of Alaska and sharing the Prudhoe Bay-Valdez oil pipeline was turned down by BP.
Siting the process on a "stranded" gas field makes use of an otherwise intractable source of energy as the gas-to-liquid process creates more readily transportable end-products directly. Otherwise the low efficiency of the gas-to-liquid process compares unfavourably with using natural gas directly in, say, a combined heat and power generation plant.
Synthesis from coal
Town’s gas once came from coal gasification, one of the by-products being benzole, which was added to petrol. Liquid fuels can also be manufactured from coal tar, but as a by-product of a coal-using industry like steelmaking, the quantities available are minimal. When coal was "king" there was considerable research into coal-based products capable of substituting for oil which at that time was imported.
During the second world war, Germany produced its liquid fuels by synthesis from coal liquefaction. To avoid the effects of sanctions, coal liquefaction has been extensively used in South Africa by Sasol, which still has three plants running. The thermal efficiency of the conversion process is low, possibly as low as 30%. In the USA work is proceeding on co-processing of a crude oil and liquefied coal blend, which can be used as feedstock to a normal oil refinery. Worn tyres are also used with coal for liquefaction.
Electricity generation still uses coal, but gas turbine plants are supplying an increasing share of the demand. Indigenous natural gas which could have been used for the production of liquid fuels has been consumed for domestic and industrial heating and electricity generation. As oil depletes, gas will be increasingly used for synthesis of transport fuels and as gas reserves deplete, recourse will finally turn to synthesis from coal.
Motor fuel
Trucks and cars can run on liquefied petroleum gas (LPG), compressed natural gas (CNG) or perhaps from liquefied natural gas (LNG), but as these are products of the oil and natural gas industry, this is not a solution in the long-term. Hydrogen can be used in fuel cells to produce electricity for motive power and directly in adapted internal combustion engines.11,12 Its use has the advantage of producing no carbon dioxide, but distribution and storage at filling stations and on vehicles is problematic.
Hydrogen is produced either using a fossil fuel, such as natural gas, or by electrolysis. To produce sufficient hydrogen by electrolysis and compression or liquefaction to support the needs of the current volume of road and air transport would require three times the electricity that is currently being generated. For transmission and storage it has to be compressed or cryogenically liquefied using electricity which could be used more directly and efficiently for rail and tram transport. Which ever way hydrogen is produced results in a net energy loss. It takes more energy to produce a fuel in a suitable form for motive power than is contained in it.
So liquid fuel production will move from oil refining to natural gas processing to coal liquefaction, while perhaps upstream refinery feedstock will come from from all three fossil fuels. To keep everything going, the world’s oil, gas and coal will be used until exhausted to produce liquid fuels.
As oil provides about 95% of the fuel used in transport, the greatest impact of reserves depletion will be on all forms of transport unable to convert to electricity or to make use of the limited amount of bio-diesel or bio-ethanol from agriculture. This means an increased use of rail and tramways and some electric vehicles. Road transport will be rapidly and progressively attenuated as a series of fuel crises reduce supplies drastically. Space on the motorways can then be utilised for the laying of rail tracks, rather than despoil more countryside with high speed rail. The first priority is to electrify the remainder of the UK's rail system, releasing diesel for other uses.
In the UK new car registrations have fallen in number by around 10% in five years. This is probably due to two factors, the increasing congestion on the roads and rising cost of petrol (gasoline) and diesel. Incentives of grant and free road tax has led to the arrival of electric cars, but apart from local deliveries, such as milk, electric goods vehicles are penalised by the loss of payload by the need to carry batteries. Also there is a vast inventory of diesel-powered trucks, which cannot be readily converted for other fuels.
Jet fuel
Air transport is totally dependent on jet fuel derived from oil and alternative supplies from biomass or gas and coal will be insufficient to maintain it at its current or projected level of activity. To make things worse, as North Sea oil runs out and Middle East oil predominates, so the yield of jet fuel reduces from 25% to 8%-10%. Expansion plans for air transport would require an increase in jet fuel production of 260% by 2030 and will not be realised.
The UK is now a net importer of oil and gas. Escalating world crude oil prices and the parallel rise in the prices of alternative fuels with little British production to moderate them will mean a drastic reduction in air travel and there will be no need for new terminals and runways.
See How many
air-miles are left in the world’s fuel tank?
Prognosis
In 2000 transport consumed 25% of total energy in the UK. The proportion of the world’s energy used by transport is projected to reach 50% by 2020, but this assumes no limitation in the supply of energy and the competing energy demands will have to be reconciled to make the best use of a declining availability. What is therefore required is a strategy designed to reduce transport dependency on liquid fuels or to reduce the requirement for transport.
This will be desperately difficult for the undeveloped nations when suffering from drought and famine, with no alternatives to diesel-engined trucks for distribution of aid over the large distances involved. Jet fuel for food "drops" by aircraft will also be expensive for the aid agencies.
To bring the situation into focus Table 2 shows the consumption of energy in the UK in 2014 by sources, based on BP's 2015 Statistical Review.
Table 2
UK 2014 Primary Energy Consumption
|
million tonnes/annum oil equivalent (Mtoe) |
Gb/annum oil equivalent |
EJ
exa- joules |
% |
|
|
Oil |
69.3 (39.7 produced) |
0.51 |
2.91 |
36.9 |
|
Gas |
60.0 (32.9 produced) |
0.44 |
2.52 | 31.9 |
|
Coal |
29.5 (7.0 produced) |
0.22 |
1.24 |
15.7 |
|
Nuclear |
14.4(th) 4.8(e) |
0.11(th)0.037(e) |
0.65 | 7.7 |
|
Hydro |
1.3 |
0.01 |
0.05 |
0.7 |
| Renewables | 13.2 |
0.10 |
0.55 | 7.0 |
|
Total |
187.9 |
1.38 |
7.89 |
100 |
Primary energy consumption in the UK fell 6.3% over that in 2013 of 200.6 Mtoe to 187.9 Mtoe.
Table 2 indicates that in 2014 around 68.8% of the UK’s energy was derived from oil and gas and 34% of the UK's oil and 48% of its gas was imported. Oil consumption has decreased by 16.5% since 2005 (69.3 Mtoe from 83.0 Mtoe), natural gas consumption has decreased by 20% since 2004 (60.0 Mtoe from 87.6 Mtoe), while coal consumption has decreased by 32% since 2006 (29.5 Mtoe from 40.9 Mtoe).
Electricity consumed has decreased by 16% from 2005 (335.0 TWh in 2014 from 398.3 TWh in 2005). About 40% of the primary energy consumed was used for electricity generation. In 2014 indigenous coal supplied 15.7% of the UK energy requirements. The contribution made by renewable energy sources increased from 6.6% in 2011 to 7.0% of total energy consumption in 2014 .
What should the UK’s energy policy now be in relation to oil and gas supplies? It might have been sensible to block exports and sacrifice the revenues of the oil exploration companies and the taxes raised therefrom in order to secure a few more years of secure supply. Since oil was available from elsewhere it might also have been pertinent to have suspended UK production, conserving the UK’s limited oil reserves for ameliorating a future crisis. However, this would not have been compatible with the concept that future UK energy supplies rely on a "liberalised" market, particularly in respect to gas from Russia, Norway and elsewhere via pipelines routed through the EU and imported LNG.
In the US hydraulic fracturing or "fracking" of shales has produced large quantities of natural gas and light crude oil and it is hoped that this could be introduced in the UK to alleviate the need for imports. However, in the US prospectors were given a "holiday" from regulation with disastrous consequences for health, water contamination and the environment with the need for constant new well drilling of maintain production. In the UK rigorous conformance with regulations will make fracking for "dry" gas uneconomic and prospectors are drilling test wells for "wet" gas with NGLs and oil.
However, the UK will remain a net importer of oil and gas and in 4 or 5 years will be virtually totally dependent on imports of oil and gas.
In 2002 the government had to rescue British Energy, the biggest private nuclear generator from bankruptcy. In 2007 and in 2008 several advanced gas-cooled reactors were shut down for maintenance with the occurrence of cracks in boiler tubes and graphite moderating blocks. In these circumstances it is unlikely that sufficient capital will be raised to build new stations or to fund alternative means of electricity generation. Although a "liberalised" energy market has lowered prices, the participating generators cannot be allowed to fail and will draw on public funding to survive.
The coalition UK government in 2010 concluded that nuclear power would only be viable by levying the fossil fuel sector with a "contract-for-difference" price mechanism. Two majority French state-owned companies, EdF and Areva have expressed interest in building reactors in the UK, but have insisted on a guaranteed inflation-proof "strike" price for 35 years of the operational life of the stations, amounting to a subsidy.
In 2013 a deal was struck with EdF to finance twin Areva EPRs at Hinkley Point C by the imposition of a "strike" price of £92,50 to be made up through a counterparty by a CfD levied on its gas and coal competitors.
On the other hand, 76% of the UK’s coal is imported. At the current production rate the UK coal R/P ratio is 20, but this would be halved without the current level of imports. If having used up our oil and gas, UK coal was used for all the current combined requirements of oil, gas and coal, it would require 300 m tonnes oil equivalent/annum (which is 40 times current UK coal production). It may be that undiscovered coal reserves might be found when required, but from 2016, the UK will be almost totally dependent on imports for its fossil fuel requirements as the remaining deep mines for coal close. Oil and gas imports will be restricted by increasing global demand for production from decreasing reserves and prices will rise excessively, so coal will be the only plentiful fossil fuel available for importation. In the US the substitution of shale gas for coal for electricity generation has reduced the price of coal and in 2014 in the UK coal was the predominant fuel for electricity generation.
Energy supplier countries use the revenue from sales to sustain their domestic economies and will not be reluctant to export their oil, gas and coal until, as has happened in the case of the UK, internal consumption exceeds production. For example, in Saudi Arabia water supplies for the capital, Riyadh are pumped overland from desalination plants located on the Gulf coast, requiring energy. Unless alternative solar energy plants are introduced, oil supplies for water production will take precedence over exports. In any case in 2014 Saudi Arabia used 28% of its oil production internally, up 58% (3,185 b/d) from the quantity consumed in 2005 (2,013 b/d). Russia consumes 70% of its natural gas production internally. It is not difficult to imagine a situation in which Russia's expanding economy consumes all of its indigenous gas production, leaving none for the EU.
Nuclear power in the UK is due to be phased out by 2035 unless the current policy of planned obsolescence is revised, but in any case produces no liquid fuels (other than liquefied hydrogen by electrolysis with compression or cryogenics for storage). Although nuclear power produces 7.7% of the UK's primary energy, only 34% of this is usable as electric energy and if used for hydrogen electrolysis and liquefaction the resultant motor fuel is only around 17% of it, or less than 2% of the UK transport's requirement.
Dependency on oil and gas could be relieved by developing coal technology for producing liquid fuels and chemicals. The restoration of the coal mining industry is questionable, as is the possibility of increasing its output by a factor of 30. Even so, the creation of a coal liquefaction industry based on some expansion of UK coal mining and on coal importation is likely to take a minor role.
Fortunately, there has been a move from high energy-using heavy manufacture to service industries over the last 30 years. Steelmaking capacity has declined over the last decade, relieving demand on energy and reducing pollution. This has benefited regions like Strathclyde once dependent on heavy industry, which has boomed in prosperity since the polluting industries have largely disappeared, allowing science-based and service industry to prosper. As the passing of peak oil takes effect, motor manufacturing will decline so that the steel it uses will also reduce in quantity. Unless the provision of rail tracks on emptying motorways provides a need for rail sections and rolling stocks, there will be a decreasing need for steel.
However, many of the heavy industrial products we need now come from abroad. Because of a shift to the Far East of so much manufacturing, some heavy industry will have to be retained or re-established, perhaps fuelled by coal or coal gas once more.
There is already recognition that sustainable and renewable forms of energy are required and a start in establishing wind farms and just one tidal current system has been made. However, serious investment in these and other technologies is needed now, before the ability to raise the capital is lost. Even so there is little chance that alternative energy sources (reviewed below) will match the shortfall from non-renewable sources, so life will have to be reshaped to use less energy. In any case most alternative technologies provide electricity, with only bio-diesel as a significant liquid fuel.
It is planned to supply 20% of electricity from renewable energy by 2020, but from thereon further sites for wind farms will be difficult to find. If imported coal makes up the loss of that currently supplied from the indigenous coal industry (which is being allowed to decline) a further 17.5% of current energy consumption could be found, totalling 25% of what is currently consumed. The 2014 UK consumption of primary energy fell 17% from what it was in 2005..
Thus with the dwindling of global oil and gas reserves, international competition for supplies of coal, the demise of the indigenous coal industry together with the gradual termination of nuclear power mean that in order to be secure from the consequences of external events, the UK has to rearrange its economy to run with only around 25% of its current energy consumption.
Biological energy
This requires a two-pronged attack. First, the crops for the creation of a renewable source of energy must be planted. Forest products can be used for direct-firing, e.g. willow can be grown for combustion. Wood can also be grown for the creation of wood alcohol. Vegetable oil from oilseed crops with alcohol distilled from sugar beet can be processed with a catalyst into bio-diesel.
The second is for the industrial base to be developed. There are now several power stations burning broiler litter and willow. The need for incineration of animal wastes (now no longer processed as animal feed) can be assisted by augmentation with domestic rubbish and used for electricity generation. Biomass generating stations are now in operation around the coast to facilitate the importation of wood-chip, which can go directly for combustion.
Obsolete sugar refineries can be converted to alcohol production. Currently many may be demolished as sugar consumption dwindles resulting from health campaigns. Urgent action to avoid dismantling is needed.
Also breweries and distilleries could be converted for industrial alcohol production to supplement liquid fuels and provide a component for bio-diesel. For motive power a liquid fuel as an alternative to diesel is required and alcohol can be used in modified engines directly or as an additive to petrol.
Bio-diesel can be produced from vegetable oils with some alcohol. This would also provide an alternative tractor fuel and an activity for farmers in place of animal rearing. It would also provide associated industrial processing activity. The limitation is the amount of land needed to grow sufficient rape seed for oil extraction.
Agriculture requires 1.4 million tons oil equivalent for motive power. Around 500,000 hectares are currently devoted to growing rape as an agricultural product and around 1,500,000 additional hectares would be required for rape and beet cultivation for the processing of sufficient bio-diesel to make agriculture self-sufficient in motive power. This represents around 8.5% of the agricultural land in current use. This needs to be balanced against other demands on the same land, but some of the set-aside could be re-employed.
Alcohol is cheaper if produced from sugar cane rather than beet, as the bagasse can be burnt to provide steam for distillation. Rape oil can be augmented by importing other oils such as palm oil, but these will have a transport premium.
Landfill gas electricity generation already makes a valuable contribution of more than 4 TWh per annum or 1.2 % of national electricity consumption. This is likely to continue for 10 years or so, depending on waste management policies. Landfill sites are progressively harder to locate and an increasing amount of recyclable material is separated in an attempt to reduce the amount disposed in landfill. The remaining waste should have a higher proportion of fermentables and could perhaps be handled in large enclosed vessels to allow methane generation.
Anaerobic digestion
Fuel crops, such as maize, energy beet and cereals are grown as feedstock for an increasing scale of anaerobic digestion producing biogas for electricity generation and for direct injection into the gas grid. Brewery and food wastes are added to the mix of feedstocks.
Geophysical energy
Powerful geophysical forces can be harnessed to provide clean and sustainable sources of energy. Wind, waves, the lunar energy of tides and solar energy (direct and including evaporation creating rainfall) are already harnessed for electricity generation, but much more can be done. It ought to be possible to provide the equivalent of nuclear power generation from geophysical sources, matching its phasing-out.
Hydro-electricity is the most established form of water power, but only provides around 0.8% of the UK's energy requirements, compared with New Zealand where the contribution is 30%. As the timings of wind, rain and sun are in a random fashion, more pumped storage systems are needed, whereby water is raised to an elevated reservoir when surplus electricity is available and the head of water is used to augment generation at peak times.
There may yet be more opportunities for water power, perhaps even in rivers. For flood protection (See 17. Climate) large pumping stations associated with a national water grid are envisaged to take excessive water from rivers. In low lying areas where the siting of reservoirs is impractical, excess water from the national grid could be pumped into off-shore lagoons for generating electricity when emptying into the sea, thus recovering some of the energy used for alleviating flooding.
Wind power is harnessed by the installation of wind generators, often clustered in "wind farms". They are opposed because of their visual impact and noise from the revolving blades and many are consequently planned off-shore. There are also objections to off-shore wind farms because of the potential danger to birds. However, this is the only currently available substantive method of power generation able to provide up to perhaps 20% of the current energy consumption. The turbine towers could be associated with a nearby reservoir for a wind farm collective system. This would have the benefit of evening out the transmission capacity needed.
Wave power has potential but is undeveloped. There are sea-based types which make use of the energy from sea swell and shore-based systems which use incoming waves to force an air current through a shore-based chamber in which a counter-rotating turbine makes use of the bi-directional air flow to generate electricity. Both suffer from the damage caused by the wave forces they are attempting to harness.
More use could be made of tidal power, which in contrast to wind and wave power is predictably available in accordance with tide tables. At one time tide mills in association with tidal ponds were common. A working example can be seen at Woodbridge in Suffolk. It would be possible to create off-shore tidal lagoons with similar technology to that employed to create the Brighton Marina with interconnected caissons to form an enclosure. Electricity is generated during filling and emptying through turbines as the tide flows and ebbs. Estuarial barrages also make use of tidal flow and ebb, but cause problems for river navigation and to fish.
A better way to harness tidal power is a system of undersea turbines currently under test 15. The turbines are below the surface where they are unaffected by bad weather and placed in current streams at places where the tidal flows are enhanced by the underwater topography. They are free from the environmental concerns of off-shore wind farms as they have a low above-surface profile - no more objectionable than a large buoy.
Solar PV is useful for small users such as communications, but is too capital intensive to be a universal provider of electricity. The large surface area required means that only very light vehicles can be propelled and movement of heavy goods is not feasible. However, there are plans for a massive solar power initiative named "The Trans-Mediterranean Renewable Energy Cooperation" (TREC) which envisages the installation of massive solar thermal power plants in the North African deserts with transmission lines crossing the Mediterranean.
In Germany solar PV has become a major provider of electricity, while there is a significant contribution from it in the UK on house rooves and in large installations on land. In Africa solar PV provides lighting for LEDs in remote villages and for charging mobile phones.
Solar thermal provides domestic hot water.
Geothermal energy is obtained from hot rocks underground, often seen as as geysers and hot springs in volcanic regions. The prolific use of volcanic rocks in Iceland for district heating and power generation is unlikely to be repeated here, but there are buried heat resources that can be used for heating buildings. It requires water to be pumped through borehole circuits. As an example of this in the UK, a school in Cornwall is heated by this method.
So wind power being fully developed and universally applied is the most likely successor to fossil fuels, but only in connection with a drastic reduction in energy requirements. Marine current tidal power once developed has the potential to provide a similar contribution.
A form of geothermal energy is the use of domestic heat pumps, extracting low-grade heat from the ground, then in a cycle akin to refrigeration, raising its temperature to a higher grade.
Methane hydrate
Methane hydrate belongs to a group of compounds known as clathrates. A clathrate is formed when molecules of one type form a lattice structure around a cavity, while molecules of another type are inside the cavity. A methane hydrate is a cage-like lattice of ice containing methane. The molecules of water create a crystalline structure holding methane molecules via hydrogen bonds to the oxygen atoms of the water. They were found to be naturally occurring in a Siberian gas fields in a frozen form and later in ocean sediments.
Methane hydrate has been seen as a possible energy resource with enormous potential. However, it has proved difficult to extract a viable sample. As soon as temperature rises or pressure is released the methane is released from the ice lattice and dissolves in water or escapes to the atmosphere. Moreover the occurrences are discontinuous and it is now seen as an unreliable source of energy.
Viability of alternative energy sources
In 2011 the UK government introduced an energy market reform to encourage the introduction of low-carbon forms of energy. There are Feed-in-Tariffs for solar PV, contracted over 25 years and remunerated by the electricity distributors. There are also Renewable Heating Incentives for encouragement of the utilisation of heat pumps. More controversially there are four incentives for wind and nuclear power. There are Contract-for-Difference/Feed-in-Tariffs for nuclear in which prices are topped up by the competitors to a pre-agreed level, low-carbon peak shaving grants for capacity available when needed, a carbon auction "floor" price topped up by a carbon tax on polluters plus the application of swingeing emission performance standards.
There is a more fundamental assessment needed when considering alternative energy systems, viz., the ratio of energy inputs required to build, supply and maintain the system to the energy output over the plant life cycle. Systems must therefore be rated in terms of this ratio and those with the lowest input/output ratios preferred. Hydro and wind power offer the lowest inputs of around 7% of their lifetime outputs, with similar disputed claims for nuclear power (See below). Photo-voltaic solar power requires high energy inputs during manufacture and only qualifies for specialist low power users, such as remote telephones and calculators. One form of photo-voltaic generation requires a higher energy input than the output obtained.
The energy inputs are mostly reliant on liquid fuels with global warming consequences. For example maintenance of wind generators requires the use of mobile cranes to access elevated components. These are currently run on diesel, although it would not be impossible in a wind farm to drive an electrically driven crane from the other generators. Unless carefully considered and organised accordingly, alternative energy systems will contribute to global warming by requiring fossil fuel inputs.
Nuclear power
The costs of producing the uranium fuel was covered mainly by the atomic weapons budget, as is the continued use of energy in storing and handling the waste material. When privatised, the state retained the uneconomic supporting infrastructure, but imposed a levy on the generator, British Energy, of £300 million/annum as a contribution to the costs of re-processing and waste disposal. In a liberalised market with natural gas allowed to be used for electricity generation and with this levy, nuclear power could not compete and in 2002 had to be financially supported by the government. "Nuclear liabilities" of more than £5 billion were taken over by the government in return for an equity share in British Energy, some of which has subsequently been sold, leaving the government shareholding at 35%.
As nuclear power generation theoretically creates no "greenhouse gas" the industry hoped to benefit from the imposition of carbon tax on others. 13 But the uranium mining, ore milling and processing, the fuels used by the civil engineering in building a nuclear station, the manufacturing and construction of the equipment do, as does the mining for waste disposal, so it cannot claim full immunity from a contribution to global warming. Also the de-commissioning and demolition of a station can take decades of which the latter also has to be performed with mobile machinery needing liquid fuels.
The energy inputs required by nuclear generation come under five headings:
The industry rates the sum of these inputs to represent around 9% of the life cycle output of a typical nuclear station, while opponents argue that a figure of 70% is applicable.14 The main source of contention is the energy used for mining, milling and enriching the uranium ores which requires the burning of fossil fuels and the release of "greenhouse gas". The expenditure of energy in the first two processes depends on the ore grade and as the richer ores are extracted it rises to a point where the additional energy required for the processing of leaner ores means that in its life-cycle a nuclear station could produce more CO2 than an equivalent gas-burning plant.
Perhaps of more significance is the availability of ores of a high enough grade to support nuclear generation in the long term. Once the richer ores are exhausted, the energy input/output ratio worsens to a point where the "greenhouse gas" advantage over fossil fuels is lost and the energy produced is less than consumed.
By considering only those ores of an "energy economic" grade a global R/P ratio (Reserves/Production ratio) can be derived for nuclear fuel. If the energy used in producing a particular generation rate is subtracted from it and this is related to the amount of uranium consumed the industry claimed R/P ratio of 50 for the current global generation rate is effectively reduced to 15. If hypothetically all electricity were to be provided by nuclear power, the R/P ratio reduces to 3. Thus the nuclear power industry is subject to the same resource attenuation as all other activities highlighted by the "Limits to Growth" 2 and is not sustainable.
In 2006 and in 2007 the UK government in successive energy reviews decided that nuclear power is only viable if able to "sell" its carbon "credits" to carbon emitting equivalents in the emissions trading system (ETS). A White Paper was issued in 2008 in which the private sector was invited to build an undefined number of new stations with no government subsidy other than the issuing of the carbon "credits". The most likely nuclear power station builder, EdF realised that such credits would depend on the continuation of fossil fuel combustion providing an ability and need for the purchase of the credits. As fossil fuels are running down it requested that such credits should be of a guaranteed value for the duration of the projects, which is at least the 60 years operational cycle.
A factor in the decision was the reduction in "greenhouse gas" emissions falsely claimed by the industry, so the question of ore grades and reserves should have been taken into account. In the case of the currently operating nuclear reactors, the energy involved in their construction and in providing the stock of uranium fuel is already expended. So the policy most evident is to fund the losses of the industry until the existing reactors have completed their useful life. However it is likely that all seven of British Energy's Advanced Gas-cooled Reactors (AGR's) will be closed prematurely as the graphite moderating blocks are disintegrating, which could compromise safety by preventing the dropping of control rods into channels filling with debris.
There is no case for building more nuclear power stations, because mining production of the higher grade ores is insufficient to support more than half of the existing reactors and if recourse had to be made to the lower grade ores, as is suggested by the industry to make up for the deficit, then over their life cycles they would consume more energy than they could contribute and release an equivalent amount of CO2 to that from a gas-fired station of the same output or more. They will simply add to the legacy of de-commissioning and waste handling, demanding an energy expenditure when energy will be at a premium.
Primary uranium production in 2018 from mines was only 53,498 tonnes. For the current level of nuclear power (2,739 TWh or 10 EJ) the uranium demand of 65,405 tonnes had to be met by topping up the production from mines with so-called secondary sources, such as inventories, diluted ex-weapons grade highly enriched uranium, MOX and re-worked tailings. For all electricity generation (20,200 TWh or 73 EJ) to be from nuclear power, 460,000 tonnes/annum of natural uranium would be required. With the end of the secondary sources, mining would have to increase ten fold.
The substitution by nuclear power of the primary energy derived from the combustion of fossil fuels needs special scrutiny, because in its use the electrical energy generated is not directly usable on road or air transport and although it can be applied to rail or tramways with fixed conductors, it would have to be used for electrolysis for the production of hydrogen and for its compression or liquefaction.
Assuming mobile transport requires 40% of global primary energy (473 x 0.4 = 189 EJ) and that the energy efficiency of a diesel engine at 46%, the useful energy is 87 EJ. Taking into account the lower heating value of hydrogen (120 MJ/kg), this is equivalent to 725 x 109 kg H2, which to get in its liquid form requires by electrolysis and liquefaction 75 kWh/kg equivalent to 54,375 TWh, which at 34% generation efficiency requires 576 EJ of primary energy. So if transport could be based on a hydrogen economy the global primary energy requirement for nuclear power rises from 473 EJ to 860 EJ. (i.e., 473 -189 +576 = 860) The problem is that electrical energy of whatever means of generation is a poor substitute for the adaptable primary energy obtained from fossil fuels.
This would require production of 2 million tonnes/annum of uranium (exhausting the entire global reserves in two years) to fuel 10,000 nuclear power stations of 1 GW(e) capacity (each providing 85 PJ primary energy, 32 PJ electrical energy). The idea that nuclear power on its own can solve the coming energy crisis is therefore totally fallacious.
Moreover, nuclear power stations present a deadly target for terrorist attack with potentially unimaginable contamination consequences. The high costs of building nuclear power stations are likely to rise with demands for increased security, requiring a greater construction energy input. To augment the supply of uranium ores, part of the current inventory of the plutonium created as a by-product of nuclear reaction is to be processed at Sellafield as reactor fuel (MOX), though the proportion of fuel obtained is less than 5% of the total required. As the most poisonous substance known to man, the handling of plutonium requires extraordinary care and the use of it is controversial.
Nuclear sustainability depends on the breeding of new fuel in a number of breeder reactors. There is no commercially available fast breeder reactor, which in any case requires a facility for manufacturing plutonium fuel and a processing plant to separate the bred plutonium from the depleted uranium "blanket". There is little chance of such a tripartite complex being developed without inter-government financial support and while the nuclear industry falsely claims that there is no uranium fuel supply problem it cannot concurrently make a case for such an intervention, which in any case, as have previous attempts, is certain to fail.
It would be better to reduce energy requirements rather re-establish an industry with such a potential for menace to public life and the viability of which is subject to doubt. (See "Why nuclear power is not the answer to global warming")
Hydrogen
Thermal properties and production of hydrogen
The higher and lower calorific values of hydrogen are:-
Higher heating value (HHV) = 142 MJ/kg = 39.4 kWh/kg
Lower heating value (LHV) after latent heat is subtracted = 120 MJ/kg = 33.33 kWh/kg
The lower value is obtained by combustion in an engine. Hydrogen does not occur naturally and has to be extracted and processed before it can be used as a transport fuel.
There are four processes, viz.,
(i) Steam reforming of methane
(ii) Electrolysis of water
(iii) Compression
(iv) Cryogenic liquefaction.
These can be combined as (i) and (iii) or (i) and (iv)
or (ii) and (iii) or (ii) and (iv)
(i) Steam reforming of methane
Hydrogen can be extracted from methane by steam reforming in two stages.
2CH4 + 3H2O = CO + CO2 + 7H2 and CO + H2O = CO2+ H2
32 kg methane with 72 kg steam yields 16 kg H2 and releases 88 kg CO2, but the process is only 70%-90% efficient, so the yield is reduced to 12.8 kg. Assuming 80% efficiency, 2.5 kg methane (2.5 x 55 MJ = 137.5 MJ) is needed to yield 1 kg hydrogen (120MJ) while releasing 7 kg CO2. The 7 kg steam required contains 24 MJ total heat, bringing the input to 161.5 MJ/kg or 45 kWh/kg.
The
equivalent power used to obtain the energy of 33.33 kWh/kg in the hydrogen is 45
kWh/kg and 7 kg of CO2 is released. Thus more energy is used to
extract hydrogen from the methane than obtained in it.
(ii) Electrolysis of water
Electrolysis can consume between 3.7 and 4.5 kWh/Nm3 of hydrogen, which taking the mean is gravimetrically 58.6 kWh/kg (Say 59)
(iii) Compression
The energy used to compress hydrogen to a suitable storage pressure is around 12% of the HHV or 0.12 x 142 MJ/3600 KJ = 4.7 kWh/kg (Say 5)
(iv) Liquefaction
For large scale plants the energy used to liquefy hydrogen is around 40% of the HHV or 0.40 x 142 MJ/3600 KJ = 15.8 kWh/kg (Say 16)
(ii) + (iii) 59 + 5 = 64 kWh/kg
(ii) + (iv) 59 + 16 = 75 kWh/kg
Equivalent quantity required for UK transport in 2002 as an example
Cars use compressed hydrogen (Honda) or liquefied hydrogen (BMW and GM) while aircraft will need to use liquefied hydrogen because of weight and space requirements.
An effective energy content of 120 MJ/kg H2, means that vehicle energy of 1680 PJ (equivalent to 40 million tonnes /annum of petrol and diesel) would require 14 x 109 kg H2/annum, while aircraft energy of 546 PJ (equivalent to 13 million tonnes of jet fuel) would require 4.55 x 10⁹ kg H2/annum.
This works out at 14 x 64 x 109 = 896 TWh for compressed gas
and 14 x 75 x 109 = 1050 TWh for liquefied gas.
For aircraft it works out at 4.55 x 75 x 109 = 340 TWh
For the UK this means that to substitute for the 2019 level of road and air transport fuel by hydrogen would require from 1236 TWh to 1390 TWh of electricity generation, compared to the total UK generation of 400 TWh in 2005.
While in the future a favoured minority will use hydrogen-propelled road vehicles, this would be such an inefficient use of renewable electricity that road transport will be substituted by rail (which can use electricity directly in traction engines). The establishment of a global hydrogen infrastructure for air transport seems an impracticable prospect. A tripling of global air traffic envisaged by 2030 would require electricity generation of 7000 TWh to be able to substitute liquid hydrogen for 260 million tonnes of jet fuel, which by then will be unavailable in sufficient quantities.
Exhaustion of non-renewable energy resources
The UK probably still has oil and gas reserves under the continental shelf, but the retrieval on the Atlantic side will be progressively more expensive the further round the North coast of Scotland exploration progresses. The increase in crude oil price is not leading to an increase in exploration and development of new oil fields by the oil majors, but in the acquisition of companies with reserves holdings or in gas ventures.
The UK coal mining industry has declined and more than half of our requirements are imported: UK coal reserves have been conserved. At the 2007 production rate the R/P ratio was only 9. If as a hypothesis the UK was in siege after 2010 and indigenous coal had to be used in substitution for imported oil and gas (and assuming the liquefaction processes were available) it would last for only a few years.
The world has large coal resources, with a R/P ratio in 2007 of 133 (cf. oil 41 and gas 60). As "all-oils" and gas production rates approach their "Hubbert" peaks in 2010 and 2020 respectively, coal resources will be utilised at a greater rate in substitution for liquid fuels and chemical products. Also the thermal efficiency of coal liquefaction process is around half of gas-to-liquids equivalents, increasing its demand enormously. If, hypothetically, coal provided for the combined world 2007 production rates for oil, gas and coal, its production would peak around 2040 to 2050, tailing off thereafter, indicating that fossil fuels will not outlast the century.
Growth in demand for oil and gas is rising exponentially. Combined world production of oil and gas in equivalent units rose by around 1.50%/annum from 1990 to 2000, but from 1999 to 2000 it rose by 4%. Strong economic growth in China, India and the Far East is likely to continue until restricted by emptying reserves. Unfortunately, as reserves approach exhaustion, demand is accelerating, bringing the emptying of the reserves ever nearer. Over the last five years oil consumption has increased by 9.5% and gas by 16%.
Table 3 lists the achieved annual production rates in Gb/annum oil equivalents. The figures given refer to those extent at the end of each decade. Those for 1980, 1990 and 2000 are obtained from the BP statistical review of world energy 2001 6 and include all oils. The remainder are derived from extrapolating trends in demand growth and making assumptions on the rate of new discoveries which add to reserves. Since world production platformed to around 30 Gb/annum in 2004 to 2006, declining slightly for the first time in 2007, indicating that the peak of 30 Gb/annum forecast in 2010 is the likely outcome. Table 3
| Decade ending | 1980 | 1985 | 1990 | 1995 | 2000 | 2005 | 2010 | 2015 | 2020 | 2025 | 2030 | 2035 | 2040 | 2045 | 2050 | 2055 | 2060 | 2065 | 2070 | 2075 | 2080 | 2085 | 2090 | 2095 |
| Gb/a oil equivalent | ||||||||||||||||||||||||
| Oil | 20 | 21.0 | 23.9 | 24.8 | 27.3 | 28.7 | 30 | 26.5 | 22 | 18.2 | 15.5 | 13 | 10.3 | 8.5 | 7.3 | 6.3 | 5.5 | 4.8 | 4.1 | 3.5 | 3 | 2.3 | 1.8 | 1.3 |
| Gas | 9.3 | 10.5 | 12.6 | 13.5 | 15.3 | 18 | 21 | 26 | 33 | 26.5 | 22.5 | 19 | 16 | 14 | 12 | 10 | 8 | 6.5 | 5 | 4 | 3 | 2 | 1 | 0.5 |
| Coal | 17.1 | 21.6 | 23 | 23.1 | 21.0 | 23 | 25 | 27.5 | 30 | 34 | 41 | 50 | 60 | 47 | 40 | 35 | 30 | 25 | 21 | 17.5 | 15 | 12.5 | 10 | 5 |
| Total | 46.4 | 53.08 | 59.5 | 61.42 | 63.55 | 69.7 | 76 | 80 | 85 | 78.7 | 79 | 82 | 86.3 | 69.5 | 59.3 | 51.3 | 43.5 | 36.3 | 30.1 | 25 | 21 | 16.8 | 12.8 | 6.8 |
The table is illustrated in the chart below. As oil production reaches its peak in 2010, gas is used to take to make up the shortfall in liquid fuels. As gas passes its peak production in 2020, coal is used by liquefaction to allow liquid fuels to be available in the period 2020 to 2040. Thereafter coal also passes its peak production in 2040 and by the end of the century, all economic fossil fuels resources have been exhausted.
Figure 3
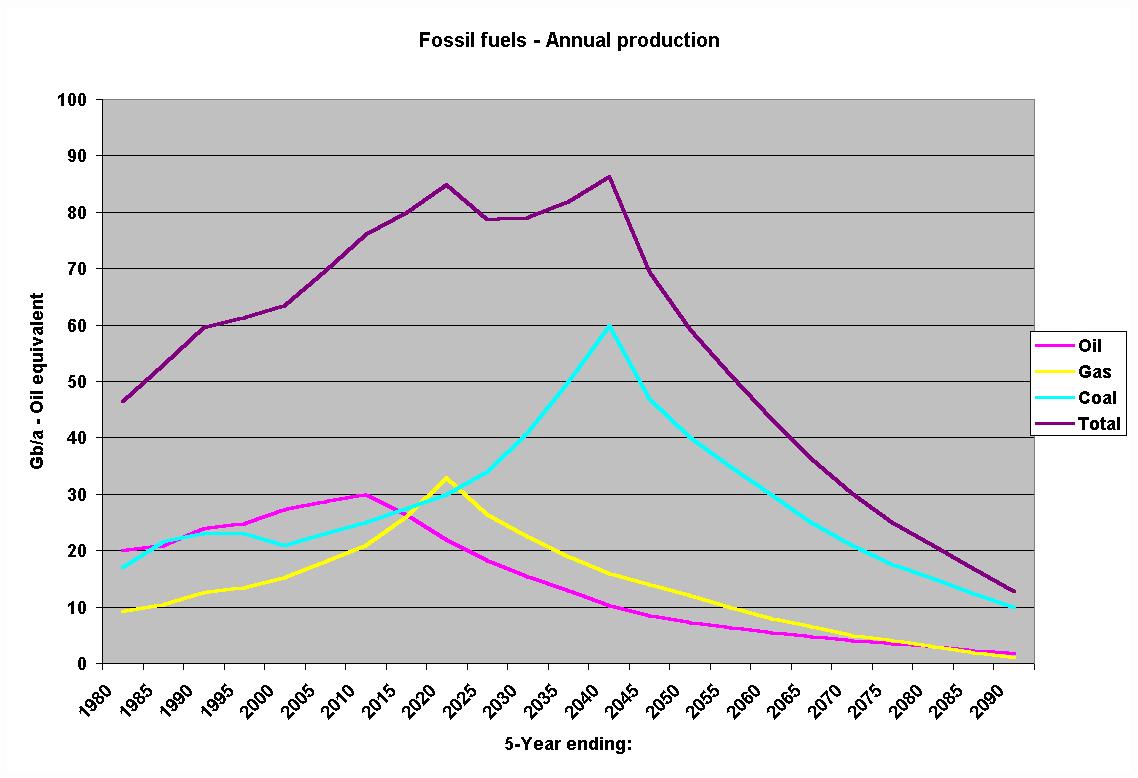
The UK government’s "The Energy Review" 9 issued in 2002 anticipated an "increasing scarcity" of oil after 2020 and increased dependence on supplies from the Middle East. The review concentrated on the risks associated with imports of gas from the Former Soviet Union and the Middle East, but failed to anticipate the use of gas for the synthesis of liquid fuels instead of the so-called "unconventional" oils which will remain largely unexploited.
Natural gas is increasingly utilised for electricity generation, but the escalating demand for liquid fuels for air and road transport will depend on the use of gas in substitution for oil as a source of jet fuel, petrol and diesel. The increasing demands on all uses of gas will bring forward its "Hubbert" peak, so that a peak in gas production in 2020 will follow that for oil in 2010 more closely than anticipated.
The investment made by the industry will be directed more towards utilising gas resources directly, rather than indirectly for the extraction and hydrogenation of bitumen and heavy oil. As normal refineries can handle liquefied coal as a blend with crude oil, the use of coal will then take precedence over the use of synthetic crude oil from oilsands bitumen, so that coal production will reach its "Hubbert" peak around 2040 and the economic extraction of fossil fuels may not survive the century.
It is not just a question of the availability of fossil fuels: it is also the efficiency of the capital employed in exploration, recovery and conversion to useful derivatives. The developed nations will adjust (whether by policy or by force of circumstances) to a different lifestyle, but the undeveloped world will stagnate. This was the key factor in the catastrophe forecast by the "The Limits to Growth" 1 in the latter half of the 21st Century, when "because of nonrenewable resource depletion ….. investment cannot keep up with depreciation, and the industrial base collapses".
The following chapters look at aspects of UK life and recommend adjustments aimed at securing the UK’s survival in this century.